Global| Mar 31 2009
Turkey -- Another Emerging Economy Reports A Dismal 4Th Quarter Gross Domestic Product
Summary
Fourth quarter Turkish Gross Domestic Product, released today, declined on a seasonally adjusted basis 4.9% from the third quarter continuing the declines of 3.6% and 1.7% in the second and third quarters, respectively. For the year [...]
Fourth quarter Turkish Gross Domestic Product, released today, declined on a seasonally adjusted basis 4.9% from the third quarter continuing the declines of 3.6% and 1.7% in the second and third quarters, respectively. For the year as a whole, GDP increased only 1.1%, the lowest annual increase since 2001.
There were two factors having a positive effect on GDP in the
last three quarters of the year that were actually suggesting weakness
in the economy. The decline in imports of 1.4 billion lira from
7.6.billion lira in the first quarter to 6.2 billion lira in the last
quarter affected GDP positively, but it suggested weakness in consumer
and business demand. The other was the increase in inventories in the
first three quarters of the year, which, again, had a positive effect
on GDP, but was beginning to reflect the piling up of unsold goods
rather than the piling up of goods in response to vigorous demand. The
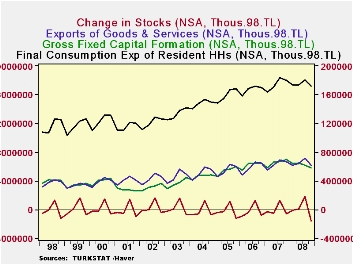
major factors affecting GDP--consumption expenditures, gross fixed
capital formation, exports and changes in stocks--are show in the first
chart.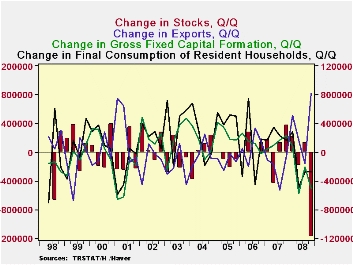
The magnitude of the fourth quarter decline in total GDP was largely due to a sharp decline in stocks as can be seen in the second chart which shows the changes in consumption expenditures, gross capital formation, exports, and stocks.
Inflation, in Turkey, as measured by the year to year increase in the GDP deflator rose steadily through the year and was 10.1% in the fourth quarter. In spite of the rise in inflation, the Central Bank of Turkey concluded that the weakness in the economy was more important than inflation and reduced its Policy rate--the overnight borrowing rate--from 16.25% in October to 10.50% currently.
| TURKEY ACCOUNT (100 Mil Yen) | Q4 08 | Q3 08 | Q2 08 | Q1 08 |
|---|---|---|---|---|
| Total GDP (NSA) Y/Y %chg | -6.17 | 1.19 | 2.75 | 7.33 |
| Household Consumption | -4.62 | -1.25 | 1.54 | 6.07 |
| Gross Fixed Capital Formation | -17.48 | -6.89 | -1.16 | 9.55 |
| Imports | -23.05 | -2.79 | 2.25 | 14.94 |
| Exports | 8.21 | 3.59 | 38.7 | 13.27 |
| Stocks | -1613535 | 1286937 | 92754 | -69591 |
| Total GDP (SA) Y/Y %chg | -4.87 | -1.70 | -3.58 | 4.10 |
| Household Consumption | -2.55 | -1.18 | -1.57 | 0.67 |
| Gross Fixed Capital Formation | -8.22 | -3.36 | -8.41 | 1.16 |
| Imports | -18.02 | -0.11 | -8.86 | 2.80 |
| Exports | -8.13 | -2.62 | -7.87 | 11.37 |
| Stocks | -824576 | 360674 | 233648 | 426821 |
More Economy in Brief