 Global| Apr 23 2008
The U.S. Export Boom: Where Do They Go?
by:Tom Moeller
|in:Economy in Brief
Summary
U.S. exports through February rose 22% from a year earlier. The double digit growth rate reflects broad based export gains to virtually all of America's trading partners. No doubt, the weaker foreign exchange value of the dollar is [...]
U.S. exports through February rose 22% from a year earlier. The double digit growth rate reflects broad based export gains to virtually all of America's trading partners. No doubt, the weaker foreign exchange value of the dollar is behind much of this growth. But the larger force driving those gains is more likely to have been the foreign countries' own economic growth. In areas where the dollar's value is down, U.S. exports are up. Where the dollar is unchanged, U.S. exports are up. Where it is up, exports also have grown.
Strongest have been the gains in U.S. exports to Europe which account for 27% of total U.S. exports. Thirty percent y/y growth through this February followed several years of double digit gain. Here is where the decline in the dollar's value seems to be paying off. Moreover, 2.6% growth in Europe's real GDP last year and 3.1% growth in 2006 is well elevated from 1-2% growth during five years and this too raised U.S. exports. 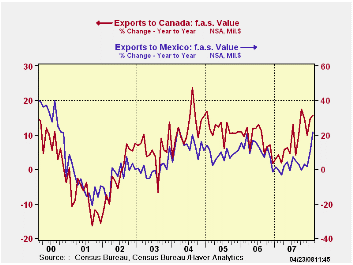
Exports to Mexico, another major U.S. trading partner, recently surged after a temporary growth slowdown last year. The recent pickup in growth reflects the acceleration in the country's rate of economic growth.
Recent firmness in exports to Mexico occurred along with still strong export growth to Canada. Here again, the dollar's decline against the Canadian currency has helped U.S. exports but Canada's solid growth in real GDP of 2.9% follows ten years of growth at about that rate. Cross border, two-way trade between the U.S. and its North American trading partners clearly plays a role in the export growth rates.
Exports to the Pacific Rim also have been strong, fueled by the dollar's lower value against the Yen and by the double digit GDP growth in China. Together, these two countries account for 10% of U.S. exports. Here again, two-way trade does play a role in boosting the U.S. export figures. In addition, the decline in the dollar's value against the Yen has supported U.S. export growth even as Japan's domestic growth was sagging. With China, U.S. export growth has boomed due to the country's double digit GDP growth as well as the decision during 2005 to let the value of the Yuan appreciate.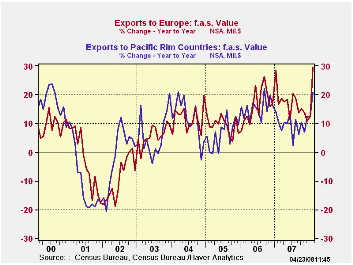
With the "lesser" trading partners of the U.S. the story is one of a boom, fueled by strong GDP growth and, in the case of exports to OPEC, higher oil prices.
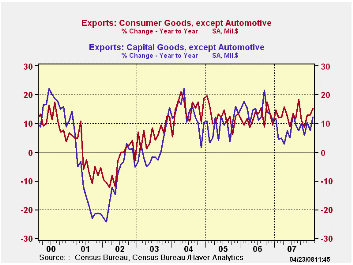
By type of product, 7.7% growth in exports of capital goods last year followed the strong 14.2% gain during 2006. Double digit growth in exports of transportation equipment resulted as airplane exports surged, but exports of electrical & nonelectrical machinery also were quite firm. In the consumer area, exports excluding autos have been growing double digit since 2004 led by double growth in exports of furniture, though apparel exports have been falling. Exports of computers recently have fallen after weak growth during 2007. Exports of food and beverages have been exceptionally strong. The 40.9% y/y growth rate through February is double the growth during all of last year which was double the strong growth during 2005 and 2006.
The figures referenced above can be found in Haver's USECON database as well as in the OECDMEI database.
Globalization and Inflation Dynamics: The Impact of Increased Competition from the Federal Reserve Bank of New York can be found here.
| % of Total U.S. Exports | U.S. Export Growth (Feb. Y/Y %) |
2007 | 2006 | Area's Real GDP Growth (4Q Y/Y %) |
2-Year Change in U.S. Dollar's Value | |
|---|---|---|---|---|---|---|
| Total Goods | 100 | 25 | 12.2 | 14.4 | -- | -17.3 |
| Canada | 20 | 16 | 7.9 | 8.8 | 2.9 | -13.1 |
| Mexico | 12 | 22 | 1.8 | 11.4 | 3.8 | -0.2 |
| Europe | 27 | 30 | 16.7 | 16.2 | 2.6 | -29.0 |
| Pacific Rim | 23 | 21 | 9.5 | 15.3 | -- | -- |
| Japan | 5 | 18 | 5.1 | 7.5 | 1.7 | -14 |
| China | 5 | 25 | 18.2 | 31.6 | 17.8 | -12 |
| South/Central America | 10 | 39 | 20.9 | 22.9 | 4.3 | -- |
| OPEC | 4 | 59 | 23.1 | 25.8 | -- | -- |
| Africa | 2 | 25 | 24.4 | 22.4 | 4.8 | -- |

Tom Moeller
AuthorMore in Author Profile »Prior to joining Haver Analytics in 2000, Mr. Moeller worked as the Economist at Chancellor Capital Management from 1985 to 1999. There, he developed comprehensive economic forecasts and interpreted economic data for equity and fixed income portfolio managers. Also at Chancellor, Mr. Moeller worked as an equity analyst and was responsible for researching and rating companies in the economically sensitive automobile and housing industries for investment in Chancellor’s equity portfolio. Prior to joining Chancellor, Mr. Moeller was an Economist at Citibank from 1979 to 1984. He also analyzed pricing behavior in the metals industry for the Council on Wage and Price Stability in Washington, D.C. In 1999, Mr. Moeller received the award for most accurate forecast from the Forecasters' Club of New York. From 1990 to 1992 he was President of the New York Association for Business Economists. Mr. Moeller earned an M.B.A. in Finance from Fordham University, where he graduated in 1987. He holds a Bachelor of Arts in Economics from George Washington University.
More Economy in Brief


