 Global| Apr 23 2008
The U.S. Export Boom: Where Do They Go?
by:Tom Moeller
|in:Economy in Brief
Summary
U.S. exports through February rose 22% from a year earlier. The double digit growth rate reflects broad based export gains to virtually all of America's trading partners. No doubt, the weaker foreign exchange value of the dollar is [...]
U.S. exports through February rose 22% from a year earlier. The double digit growth rate reflects broad based export gains to virtually all of America's trading partners. No doubt, the weaker foreign exchange value of the dollar is behind much of this growth. But the larger force driving those gains is more likely to have been the foreign countries' own economic growth. In areas where the dollar's value is down, U.S. exports are up. Where the dollar is unchanged, U.S. exports are up. Where it is up, exports also have grown.
Strongest have been the gains in U.S. exports to Europe which
account for 27% of total U.S. exports. Thirty percent y/y growth
through this February followed several years of double digit gain. Here
is where the decline in the dollar's value seems to be paying off.
Moreover, 2.6% growth in Europe's real GDP last year and 3.1% growth in
2006 is well elevated from 1-2% growth during five years and this too
raised U.S. exports. 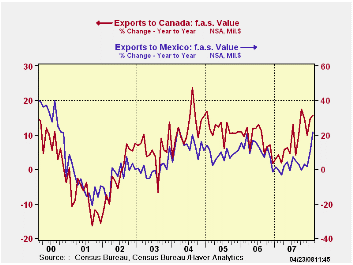
Exports to Mexico, another major U.S. trading partner, recently surged after a temporary growth slowdown last year. The recent pickup in growth reflects the acceleration in the country's rate of economic growth.
Recent firmness in exports to Mexico occurred along with still strong export growth to Canada. Here again, the dollar's decline against the Canadian currency has helped U.S. exports but Canada's solid growth in real GDP of 2.9% follows ten years of growth at about that rate. Cross border, two-way trade between the U.S. and its North American trading partners clearly plays a role in the export growth rates.
Exports to the Pacific Rim also have been strong, fueled by
the dollar's lower value against the Yen and by the double digit GDP
growth in China. Together, these two countries account for 10% of U.S.
exports. Here again, two-way trade does play a role in boosting the
U.S. export figures. In addition, the decline in the dollar's value
against the Yen has supported U.S. export growth even as Japan's
domestic growth was sagging. With China, U.S. export growth has boomed
due to the country's double digit GDP growth as well as the decision
during 2005 to let the value of the Yuan appreciate.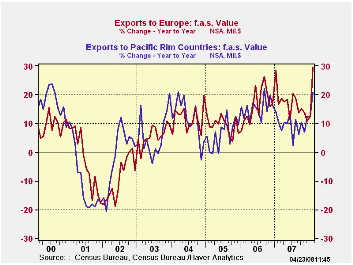
With the "lesser" trading partners of the U.S. the story is one of a boom, fueled by strong GDP growth and, in the case of exports to OPEC, higher oil prices.
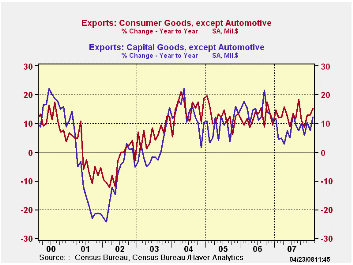
By type of product, 7.7% growth in exports of capital goods last year followed the strong 14.2% gain during 2006. Double digit growth in exports of transportation equipment resulted as airplane exports surged, but exports of electrical & nonelectrical machinery also were quite firm. In the consumer area, exports excluding autos have been growing double digit since 2004 led by double growth in exports of furniture, though apparel exports have been falling. Exports of computers recently have fallen after weak growth during 2007. Exports of food and beverages have been exceptionally strong. The 40.9% y/y growth rate through February is double the growth during all of last year which was double the strong growth during 2005 and 2006.
The figures referenced above can be found in Haver's USECON database as well as in the OECDMEI database.
Globalization and Inflation Dynamics: The Impact of Increased Competition from the Federal Reserve Bank of New York can be found here.
| % of Total U.S. Exports | U.S. Export Growth (Feb. Y/Y %) |
2007 | 2006 | Area's Real GDP
Growth (4Q Y/Y %) |
2-Year Change in U.S. Dollar's Value | |
|---|---|---|---|---|---|---|
| Total Goods | 100 | 25 | 12.2 | 14.4 | -- | -17.3 |
| Canada | 20 | 16 | 7.9 | 8.8 | 2.9 | -13.1 |
| Mexico | 12 | 22 | 1.8 | 11.4 | 3.8 | -0.2 |
| Europe | 27 | 30 | 16.7 | 16.2 | 2.6 | -29.0 |
| Pacific Rim | 23 | 21 | 9.5 | 15.3 | -- | -- |
| Japan | 5 | 18 | 5.1 | 7.5 | 1.7 | -14 |
| China | 5 | 25 | 18.2 | 31.6 | 17.8 | -12 |
| South/Central America | 10 | 39 | 20.9 | 22.9 | 4.3 | -- |
| OPEC | 4 | 59 | 23.1 | 25.8 | -- | -- |
| Africa | 2 | 25 | 24.4 | 22.4 | 4.8 | -- |
by Robert Brusca April 23, 2008
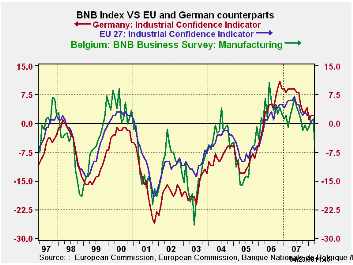
BNB index is a harbinger for the Euro-Area: The BNB index has
plunged sharply in April. This early read on Euro Area health in April
has been a GOOD SOLID barometer of what the larger and geographically
linked key EMU economies will report for the month. The chart shows the
tracking of the Belgian industrial index – usually the first read on
the Euro Area and EU in any given month - with the EU’s industrial
index and with the EU Commission index for Germany. The Belgian index
has often moved ahead of the EU and German indices. In this episode,
the Belgian index had started to strengthen ahead of any such signs for
Germany and EU before posting this recent drop. So the plunge in
Belgium in April may overstate the extent of the drop yet to be seen in
Germany and in EU. In any event, the smaller Belgian economy often sees
its BNB index move more sharply than the indices for Germany and the EU
but it is generally a good ‘hint’ for them and is not to be ignored.
MFG sector is weak
The BNB index shows us widespread weakness in Belgium. The MFG index
(an up minus down net reading, like all the other components) is at
-7.9, the weakest since it was at -10.5 in August of 2005. The domestic
production reading slipped from +6 to +2 in April but the domestic and
foreign orders indices have both plunged to register deep negative
readings. Foreign orders were last weaker in May of 2005 and domestic
orders were last weaker in June of 2003.
They’re here – not the poltergeist but worse… FX gremlins
The current assessment, by comparison, is only mildly negative at a -2
reading, and was last weaker in January of 2008 at -5: so that’s no big
deal- or is it? Foreign orders at a -8 are more serious weakened in the
current assessment, suggesting that foreign-linked weakness is here now
and not just in some vague pipeline of indeterminate length. This is
the sort of thing we have been waiting to see happen in the aftermath
of the ongoing surge in the euro. Maybe the Euro Area is not so
resilient after all. Maybe the German economy is not as ‘robust’ as its
deputy Finance minister sees things. Maybe the ECB has lost its cool in
pursuit of an inflation objective that made no SHORT TERM SENSE given
the nature of the international strains in the system. Maybe, maybe,
maybe- a great word that word ‘maybe.’
Weakness across Belgium a geographically central-EU state
Apart from industry the Belgian wholesale/retail index fell sharply to
-9.5 in April from +0.2 in March. It had briefing resided at -8 in
February of this year and then recovered - but no more. It was last
weaker in May of 2005 at -8.7. The construction index is very weak as
well. It was last weaker in Sept of 2002. The business services index
at 6.3 was last weaker in August of 2005. And so on…
Raven-mad?
Those lows in 2005 mark the time when the Euro Area was beginning to
recover from its period of extended weakness. What we see is the new
lows in the various components of the April 2008 Belgian survey go back
to OR BEYOND that point, inviting comparisons with a time when things
were bad and terms like euro-sclerosis were in vogue. The ‘New Europe’
where ‘robust’ and ‘solid’ and ‘inflation-fighting’ have been key words
and phrases may now be past their vintage years. The euro consumer
never did kick in as force to support growth. Investment-led growth can
only take you so far especially when the rest of the world is slowing
and external demand for investment goods begins to dry up…and your
currency is setting record highs while your central bank with inflation
marginally over the target starts threatening to HIKE RATES! For a time
Euro Area growth seemed to be able to out-run the speeding bullet that
was the streaking strong euro. But as Edgar Alan Poe once
wrote…nevermore. The basis for the belief was flawed from the start,
even raven-mad. Exchange rates do matter. Maybe (oh, that word again…)
now the ECB can let its policy pay some heed to that.
| Belgium National Bank Indices | ||||||
|---|---|---|---|---|---|---|
| Apr-08 | Mar-08 | Feb-08 | 3-Mo Change | 6-Mo Change | 12-Mo Change | |
| Total Industry | -7.9 | 1.2 | 0.2 | -7.1 | -7.8 | -11.7 |
| MFG | -7.4 | 1.1 | 0.5 | -6.6 | -5.6 | -9.7 |
| Production | 2.0 | 6.0 | 3.0 | 2.0 | 3.0 | 1.0 |
| Domestic Orders | -22.0 | 1.0 | 0.0 | -19.0 | -19.0 | -28.0 |
| Foreign Orders | -14.0 | 1.0 | 6.0 | -18.0 | -17.0 | -18.0 |
| Prices | 8.0 | 7.0 | 15.0 | 5.0 | 5.0 | 1.0 |
| Current assess | ||||||
| Total Orders | -2.0 | -1.0 | 3.0 | 3.0 | 4.0 | -5.0 |
| Foreign Orders | -8.0 | 4.0 | 0.0 | -6.0 | -3.0 | -11.0 |
| Inventories | 5.0 | 3.0 | 4.0 | 1.0 | 3.0 | 0.0 |
| Wholesale & Retail | -9.5 | 0.2 | -8.0 | -6.8 | -16.2 | -19.8 |
| Construction | -8.7 | 2.9 | 7.0 | -10.1 | -9.7 | -12.7 |
| Business Services | 6.3 | 6.4 | 7.5 | -0.8 | -6.5 | -7.2 |
| Comparisons: | Changes lag one month | |||||
| EU Index: Industry | #N/A | 0.0 | 0.0 | -2.0 | -3.0 | -6.0 |
| Germany Index: Industry | #N/A | 2.0 | 2.0 | -2.0 | -1.0 | -7.0 |
| Compare: BNB Index | 3.1 | -0.2 | -0.2 | |||
by Robert Brusca April 23, 2008
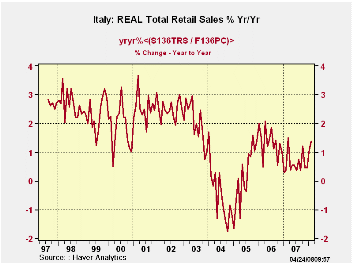
Italy’s retail sales rose by 0.3% in nominal terms in
February. Nominal growth in retail sales shows some pick up as the
overall three month growth rate has improved. But this is an inflation
effect. When we deflate nominal retail sales buy Italy’s CPI we find
three month growth is still declining… albeit at a slower pace than in
come previous periods. Still, the current quarter (2008-Q1), with two
months worth of data in hand, shows real retail sales posting a decline
at a 2.8% annual rate. This compares to an actual Q4 rise in real
retail sales of +3.8%. in 2007 Q4. As you can see from the plotting of
real retail sales, Italy’s consumers have been challenged for quite
some time. While there is a minor abatement of the ongoing sales
deceleration in place, that seems to be in the context of a broader and
still declining overall trend. So we should take no consolation from
the current nominal retail sales pick up or even from the ‘upward hook’
formation on the growth chart for real retail sales as of February. It
has no fundamental basis.
| Italy Retail Sales Growth | ||||||||
|---|---|---|---|---|---|---|---|---|
| mo/mo % | At annual rates | |||||||
| Nominal | Feb-08 | Jan-08 | Dec-07 | 3-Mo | 6-Mo | 12-Mo | Yr -Ago | Qtr-to-Date |
| Retail Trade | 0.3% | 0.3% | 0.0% | 2.2% | 1.3% | 1.4% | 0.4% | 1.7% |
| Food Beverages & Tobacco | 0.5% | 0.2% | 0.1% | 3.1% | 1.9% | 2.3% | 0.2% | 2.3% |
| Clothing & Furniture | 1.4% | 0.7% | 0.2% | 9.6% | 3.9% | 1.7% | 0.9% | 4.9% |
| Total Real Retail | 0.2% | -0.2% | -0.4% | -1.7% | -2.6% | -1.5% | -1.4% | -2.8% |
by Robert Brusca April 23, 2008
What is for real and what is whistling past the
graveyard?
Tangled trends
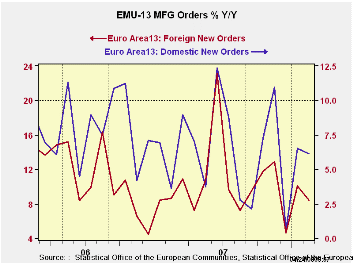
Euro Area orders are up in February, making it a two-month gain
following a dive in December. Still the 3-month growth rate is negative
for orders at a -3.9% compared to an annual rate gains of 6% over six
months and 6.6% over 12-months. So the sequential growth rates point to
some sliding in growth despite recent two-month pickup.
Orders: the lagging leading statistic…
More to the point is the fact that the orders figures for the Euro Area
are for February when many other series at the country level already
are available for March. Survey data are beginning to come available
for April as we saw in the release of the Belgian National Bank’s April
index that plunged – ironically, led by weakness in orders. The Belgian
index April result is nothing like the recent numbers we are seeing
through April. Still, the BNB survey, truncated at February, would have
been quite compatible with the figures in the table above. That begs
the question of what the trend really is, doesn’t it? At the end of the
month we we’ll get the comprehensive survey results for April that
addresses the sectors of the Euro Area and EU from the European
Commission. Based on the Belgian report we would seem to have a much
darker set of trends that will be placed before us. Germany’s Zew index
for April is already in hand and it shows a weakening in expectations
to a very low level with some so-far minor weakness in current
conditions. But this is a survey of expectations among financial
experts. The upcoming German IFO report will survey the industrial and
other sector participants directly about how their businesses are
performing. .
The drop off in the Belgian index is still isolated but it is highly
topical and reasonably comprehensive across sectors… and it is an index
known to have leading indicator properties.
Whistling past the graveyard?
For my taste the smugness of the European reaction to ongoing growth
there and the ECB’s stubbornness in ignoring the high euro exchange
rate value in setting policy has been hard to stomach since this
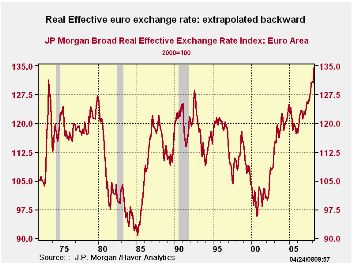
behavior has sent inconsistent signals to the markets. In looking at
the euro historically –even extending the construction of a ‘synthetic
euro’ back to the early years of fluctuating exchange rates- it is
PAINFULLY clear how overvalued that rate has become – and not just VS
the dollar! All the talk of how robust Germany’s economy remains in the
face of this strikes me as akin to the Spartans swallowing their teeth
to hide the fact that they have been injured. The index above is broad
and inflation adjusted. It is the real deal showing ‘euro’
competitiveness at its lowest level in 36 years – or more. The ECB’s
ignoring this clearly deflationary force in setting policy is similarly
puzzling. The real, broad euro exchange rate stands nearly 20% above
its average for the period.
 Single mandate does
not mean closed-minded
Single mandate does
not mean closed-minded
It does not matter if the ECB has a singular focus and mandate on
inflation with no growth mandate at all. To crank rates up and to
threaten to do it some more as temporary ‘inflation’ effects wash
through economy when they ‘know’ there is a powerful deflation force at
work (i.e. the overly strong euro) is not good monetary policy. The
German government has long known its place in such monetary fights and
has taken to extolling the benefits of a strong euro. I guess the
response there is this: If you can’t beat ‘em, join ‘em. Thus the
German economics and finance ministries seem in some way complicit with
this policy of excessive anti-inflation zeal. It may be that ECB-types
feel they have to lean hard against the unwanted advice urging
flexibility from the IMF. The International Monetary Fund said Monday
in its latest Regional Economic Outlook for Europe that the European
Central Bank has some leeway to loosen its monetary stance. Today aft r
the euro has screamed higher, the IMF’s John Lipsky has called euro
monetary policy appropriate as it is. I don’t know if that will end
this verbal silliness or not.
Right hand does not seem to know (or care?) what the left is
doing…
So the economic growth/inflation outlooks and assessments have flies in
the ointment. Unfortunately it seems that the more topical reports are
the weaker ones. While the title ‘industrial orders’ sounds like a
leading sort of barometer, no report is any fresher than the data it
contains. If this one continued fish you would not touch it. The
topical reports lead us to be cautious in the assessment of current
trends. Germany and Europe have for too long been too resistant to the
impact of a euro whose strength has been eating away ravenously at
their competitive positive. The resiliency of the economic data has
belied the urgency in the tone of policy makers who have sought some
help in stemming the euro’s rise. But, in the end, you can’t have it
both ways. If the euro is too strong it must do damage. If it does not,
it is not too strong. If policy markers are going to extol the vibrant
nature of their own economies as its fundamentals are being undercut
surely they can expect no urgency to help them with their nonexistent
FX problem!
Call to action: THINK!
Governmental and central banking policymakers must be on the same page
and willing to look ahead if they are to foster a correct view of their
economy. For the moment we continue to have the sort of fair-weather
analysis from officials that we were spoon fed by commercial bankers
over the previous year. We know what that is worth. It is a good time
to look closely at the data yourself and remember the key
constituencies of the policymakers that go public. I think we may be in
for a rude awakening. But that’s only one man’s opinion. And economists
are wrong at least as often as markets are… Who is ‘wrong’ now?
| Euro Area and UK Industrial Orders & Sales Trends | |||||||||
|---|---|---|---|---|---|---|---|---|---|
| Saar except m/m | % m/m | Feb-08 | Feb-07 | Feb-06 | Qtr-2 Date |
||||
| Euro Area Detail | Feb-08 | Jan-08 | Dec-07 | 3Mo | 6mo | 12mo | 12mo | 12mo | Saar |
| Manufacturing Orders | 0.6% | 2.2% | -3.7% | -3.9% | 6.0% | 6.6% | 7.0% | 11.1% | 2.7% |
| MFG Orders | |||||||||
| Total Orders | 0.6% | 2.2% | -3.7% | -3.9% | 6.0% | 6.6% | 7.0% | 11.1% | 2.7% |
| Countries: | Feb-08 | Jan-08 | Dec-07 | 3Mo | 6mo | 12mo | 12mo | 12mo | Qtr-2 Date |
| Germany: | -0.1% | 0.1% | -1.6% | -6.5% | 7.7% | 5.9% | 12.7% | 12.3% | -0.9% |
| France: | 1.0% | 4.1% | -1.7% | 14.2% | 5.7% | 9.7% | 5.9% | 4.7% | 17.8% |
| Italy | 2.0% | 2.8% | -5.2% | -2.5% | 3.9% | 9.9% | 1.6% | 11.4% | 5.5% |
| UK (EU) | -13.2% | 23.8% | -6.3% | 2.9% | 4.6% | 13.7% | -7.5% | 15.8% | 81.3% |

Tom Moeller
AuthorMore in Author Profile »Prior to joining Haver Analytics in 2000, Mr. Moeller worked as the Economist at Chancellor Capital Management from 1985 to 1999. There, he developed comprehensive economic forecasts and interpreted economic data for equity and fixed income portfolio managers. Also at Chancellor, Mr. Moeller worked as an equity analyst and was responsible for researching and rating companies in the economically sensitive automobile and housing industries for investment in Chancellor’s equity portfolio. Prior to joining Chancellor, Mr. Moeller was an Economist at Citibank from 1979 to 1984. He also analyzed pricing behavior in the metals industry for the Council on Wage and Price Stability in Washington, D.C. In 1999, Mr. Moeller received the award for most accurate forecast from the Forecasters' Club of New York. From 1990 to 1992 he was President of the New York Association for Business Economists. Mr. Moeller earned an M.B.A. in Finance from Fordham University, where he graduated in 1987. He holds a Bachelor of Arts in Economics from George Washington University.
More Economy in Brief


