 Global| Sep 01 2009
The Factory Sector Recession IsOver; ISM Index Jumps To Highest Level Since Early-2007
by:Tom Moeller
|in:Economy in Brief
Summary
According to The National Association of Purchasing Management data, the recession in U.S. factory sector activity is over. Its August composite index jumped to 52.9 from an unrevised July reading of 48.9 and reached it's highest [...]
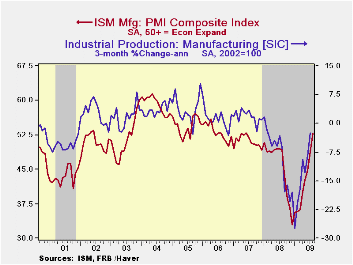
According to The National Association of Purchasing Management data, the recession in U.S. factory sector activity is over. Its August composite index jumped to 52.9 from an unrevised July reading of 48.9 and reached it's highest level since June of 2007. (Any reading above the break-even point of 50 suggests rising activity.) The latest figure was up from the low of 32.9 hit last December and it greatly exceeded Consensus expectations for a reading of 50.5. The ISM data is available in Haver's USECON database.
Last month, improvement in the ISM index again was broad-based
led by a 9.6 point surge in the new orders component. So great was the
strengthening in orders that the latest index level of 64.9 was the
highest since December of 2004. That compared to a low of 23.1 reached
this past December and reflected increases in orders reported by 43%
(NSA) of firms. Only 5% reported higher orders this past December.
Adding to that strength in domestic orders, it appeared that recessions
abroad also wound down. The export order index jumped to 55.5 versus
the December low of 35.5. During the last ten years there has been a
53% correlation between the index and the q/q change in real exports of
goods in the GDP accounts.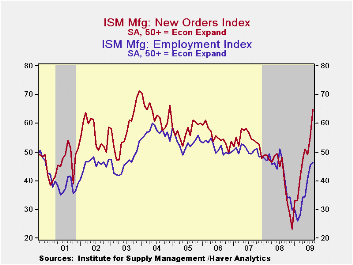
Factory sector improvement also was indicated by a rise in the employment index. Though still reflecting a drop in payrolls, the rate of decline has eased. The index rose to 46.4 which was its highest level since last August and that was up from the February low of 26.1. During the last ten years there has been a 90% correlation between the index level and the three-month change in manufacturing payrolls.
The production component also strengthened. The rise to 61.9
was to its highest level since October 2005, up from the low of 26.3 in
December. During the last ten years there has been an 84% correlation
between the level of the production component of the composite index
and the three-month growth in factory sector industrial production. It
is appropriate to correlate the ISM index level
with factory sector output growth because the ISM
index is a diffusion index. It measures growth by using all of the
positive changes in activity added to one half of the zero change in
activity measures.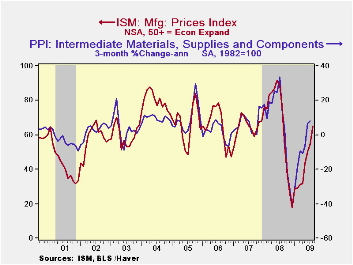
All this improvement in activity has brought with it a slowing in the speed of vendor deliveries. That's indicated by the gain in the delivery index to the highest level since 2006. The rate of inventory destocking also appears to have slowed. The inventory index increased modestly to 34.4 but it still was near the lowest level since 1982.
The separate index of prices paid again rose with improved factory sector activity. At 65.0 the reading above the break-even level of 50 was its highest level since last August and it's up from the December low of 18.0. During the last twenty years there has been a 79% correlation between the price index and the three-month change in the PPI for intermediate goods.
| ISM Mfg | August | July | August '08 | 2008 | 2007 | 2006 |
|---|---|---|---|---|---|---|
| Composite Index | 52.9 | 48.9 | 49.3 | 45.5 | 51.1 | 53.1 |
| New Orders Index | 64.9 | 55.3 | 48.2 | 42.1 | 54.3 | 55.4 |
| Employment Index | 46.2 | 45.6 | 48.0 | 43.2 | 50.5 | 51.7 |
| Prices Paid Index (NSA) | 65.0 | 55.0 | 77.0 | 66.5 | 64.6 | 65.0 |
Gasoline Prices Remain Roughly Stable As Crude Oil Prices Tick Higher
by Tom Moeller September 1, 2009
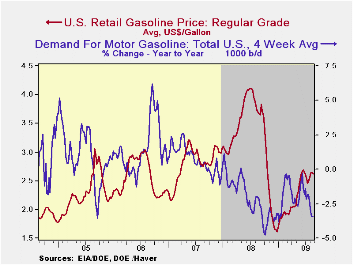
Earlier strength in gasoline prices took a breather during July and August. Nevertheless, prices remained up sharply since the year began. The pump price for regular gasoline dipped slightly last week to an average $2.61 per gallon, roughly where it's been since early June. Compared to the December low, however, prices remained up by one dollar (62%). Yesterday, that slight decline in pump prices was accompanied by a dip in the wholesale gasoline price to $1.84 per gallon. Prices had reached a high in early-August of $2.03. The figures are reported by the U.S. Department of Energy and can be found in Haver's WEEKLY & DAILY databases.
In contrast to the stability of gasoline prices, crude
oil prices have strengthened. Light sweet crude oil prices
(WTI) increased to $72.41 per barrel last week versus a June high of
$70.61. Prices have more-than-doubled since the December low of $32.37.
Most recently, the price strength eased. Yesterday the spot market
price for light sweet crude oil fell to $69.96 per barrel. Prices had
reached a daily high of $73.82 just last week.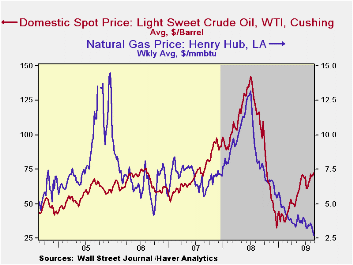
Earlier strength in gasoline prices stood against the backdrop of a firming demand picture, which now has eased. Since early-June the demand for gasoline has dropped moderately and year-to year demand slipped by 3.5%. Demand for distillate also is off sharply (-19.8% y/y) and residual fuel oil demand has given back its earlier strength (-14.8% y/y). Finally, oil remains plentiful as evidenced by an 11.3% y/y rise in inventories of crude oil & petroleum products. Inventories of gasoline recently have dropped somewhat but they have strengthened by 6.5% versus last year, the strongest gain since early last year. The figures on crude oil production and inventories are available in Haver's OILWKLY database.
Natural gas prices make up the weakest part of the energy sector's pricing environment. Falling last week to an average of $2.72 per mmbtu (-66.5% y/y), prices were down by over three-quarters from the high reached in early-July of last year of $13.19/mmbtu.
Has Greater Globalization Made Forecasting Inflation More Difficult? from the Federal Reserve Bank of Dallas can be found here.
| Weekly Prices | 08/31/09 | 08/24/09 | Y/Y | 2008 | 2007 | 2006 |
|---|---|---|---|---|---|---|
| Retail Regular Gasoline ($ per Gallon, Regular) | 2.61 | 2.63 | -29.0% | 3.25 | 2.80 | 2.57 |
| Light Sweet Crude Oil, WTI ($ per bbl.) | 72.41 | 70.82 | -37.9% | 100.16 | 72.25 | 66.12 |
U.S. Pending Home Sales Remain Firm And Rise To The Highest Level In Two Years
by Tom Moeller September 1, 2009
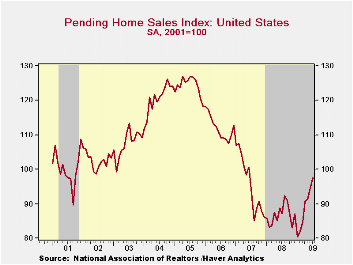 There's
been no letup in the recovery in housing demand. The National
Association of Realtors reported that during July pending, improved
home affordability boosted sales of existing homes by 3.2% from June to
their highest level since June of 2007. The gain followed a similar
rise in June sales and doubled Consensus expectations for a 1.6%
increase.
There's
been no letup in the recovery in housing demand. The National
Association of Realtors reported that during July pending, improved
home affordability boosted sales of existing homes by 3.2% from June to
their highest level since June of 2007. The gain followed a similar
rise in June sales and doubled Consensus expectations for a 1.6%
increase.
The gain in July home sales was led by a 12.1% m/m rise in
sales in the West.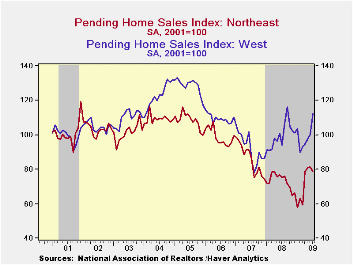 That rise was a multiple of the increases
during the last several months and it lifted sales to the highest level
since September of last year. The latest also was near the highest
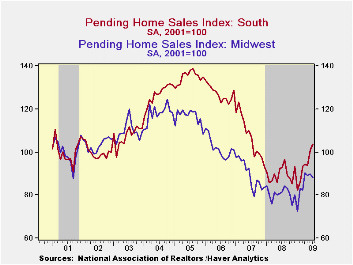
since early-2006. Sales in the South also rose a firm 3.1% to the
highest level since mid-2007. Sales in the Midwest went the other way
and fell 2.0%. They have been roughly flat since January. Finally,
sales in the Northeast dropped 3.0% from June and were roughly
unchanged since April.
That rise was a multiple of the increases
during the last several months and it lifted sales to the highest level
since September of last year. The latest also was near the highest
since early-2006. Sales in the South also rose a firm 3.1% to the
highest level since mid-2007. Sales in the Midwest went the other way
and fell 2.0%. They have been roughly flat since January. Finally,
sales in the Northeast dropped 3.0% from June and were roughly
unchanged since April.
These home sales figures are analogous to the new home sales data from the Commerce Department in that they measure existing home sales when the sales contract is signed, not at the time the sale is closed. The series dates back to 2001.
 The
pending home sales data are available in Haver's PREALTOR database.
The number of homes on the market and prices are in the REALTOR
database.
The
pending home sales data are available in Haver's PREALTOR database.
The number of homes on the market and prices are in the REALTOR
database.
| Pending Home Sales (2001=100) | July | June | Y/Y | 2008 | 2007 | 2006 |
|---|---|---|---|---|---|---|
| Total | 97.6 | 94.6 | 12.1% | 86.8 | 95.8 | 112.1 |
| Northeast | 78.8 | 81.2 | 4.6 | 72.6 | 85.6 | 98.5 |
| Midwest | 88.1 | 89.9 | 8.1 | 80.6 | 89.5 | 102.0 |
| South | 103.8 | 100.7 | 12.1 | 89.8 | 107.3 | 127.3 |
| West | 112.5 | 100.4 | 19.9 | 99.3 | 92.1 | 109.5 |
U.S. Construction Spending Holds Steady
by Tom Moeller September 1, 2009
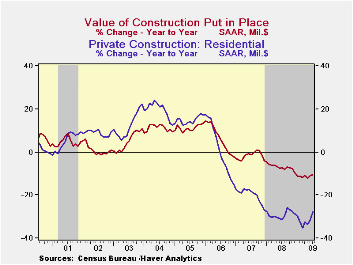
Despite improvement in the residential sector, the total value of construction outlays has continued to trend lower. The overall value of construction spending ticked lower last month by 0.2% to the lowest level since February of 2004.
The declining level of construction has very-much reflected
the weakening of corporate profitability which lowered spending in the
private nonresidential sector by 1.2% during July and 8.3% from one
year ago. That compares to the gain for all of last year of 13.2%. The
commercial sector led that weakness with a 34.6% y/y decline followed
closely by a 31.3% drop in the multi-retail sector. Office building
construction wasn't far behind with a 26.0% drop in activity. Easier,
but still significant, shortfalls versus last year were logged by the
health care (-3.6%) and educational (-10.2% y/y) sectors. Spending in
the transportation sector was off just 0.6% y/y.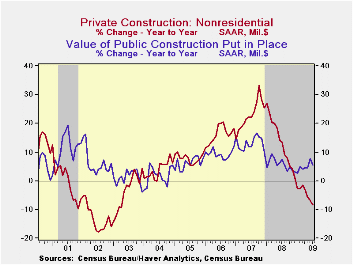
Residential building activity may be finding its bottom to the recent recession in building activity. It rose 2.3% from June. Nevertheless, spending was down by more than one-quarter from the year-ago level paced by a near-halving of single family-home activity and a 36.6% drop in multi-family spending.Sometimes it's cheaper to fix the old place up than to buy new. Spending on alterations and improvements rose 6.0% from the year-ago level.
Public construction activity has elevated the overall construction market of late. Though in July it edged down 0.5%, there's been an increase of 5.5% since last year. By sector, health care has led the y/y rise with a 29.2% jump followed by a 17.9% rise in commercial construction. Spending on highways and streets did fall slightly in July but it's up 3.4% y/y while spending on schools construction rose 4.5 y/y.
The construction put-in-place figures are available in Haver's USECON database.
| Construction (%) | July | June | Y/Y | 2008 | 2007 | 2006 |
|---|---|---|---|---|---|---|
| Total | -0.2 | 0.1 | -10.5 | -6.9 | -1.6 | 6.3 |
| Private | 0.1 | -1.6 | -17.0 | -11.1 | -5.7 | 5.5 |
| Residential | 2.3 | -0.5 | -27.8 | -29.1 | -19.7 | 1.0 |
| Nonresidential | -1.2 | -2.2 | -8.3 | 13.2 | 23.1 | 16.2 |
| Public | -0.7 | 3.6 | 5.5 | 5.6 | 13.1 | 9.3 |
German Retail Sales Up A Bit In July: Where Are The Auto Sales Resulting From Germany's "Cash For Clunkers" Program?
by Louise Curley September 1, 2009
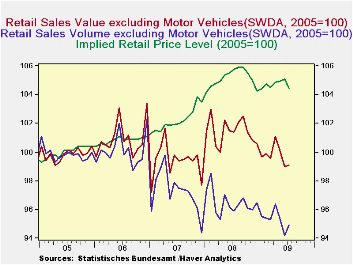 Preliminary
data show that German retail sales rose 0.7% in volume
terms in July after declining in May and June. (Final data for total
retail sales plus data on the composition of sales for the month of
July will be available in about two weeks.) The value of
retail sales rose only 0.1%, implying a decline in retail
prices. While the rise in retail sales is encouraging, its
magnitude suggests a pretty lack luster consumer.
The first chart shows the volume, value and implied price level of
Germany's retail sales.
Preliminary
data show that German retail sales rose 0.7% in volume
terms in July after declining in May and June. (Final data for total
retail sales plus data on the composition of sales for the month of
July will be available in about two weeks.) The value of
retail sales rose only 0.1%, implying a decline in retail
prices. While the rise in retail sales is encouraging, its
magnitude suggests a pretty lack luster consumer.
The first chart shows the volume, value and implied price level of
Germany's retail sales.
Perhaps the reason that these data suggest
such a lack luster consumer, is that they do not take into account the
effect of the Government's program, paying people 2,500 Euros if they
scrap their car and buy a new one, which began in January.
German retail sales data exclude sales of motor vehicles.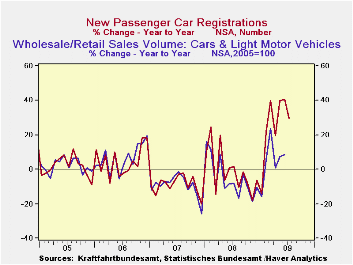 Combined wholesale and retail sales of cars and light trucks are
available in the Manufacturing, Trade & Service Section of the
Haver data base for Germany. This series combining wholesale
sales is not strictly comparable with the retail sales data and is
available only through June. The increase in passenger car
registrations is, perhaps, a better proxy for sales of new cars and
this series, which is not seasonally adjusted, is available through
July. It, too, can be found in the
Manufacturing, Trade & Services section in the Haver data base
on Germany. The year to year increases in these two series
are shown in the second chart. The year to year
increases in car registrations since January have been particularly
striking and suggest that consumers have a higher propensity to spend
than the retail sales data would suggest.
Combined wholesale and retail sales of cars and light trucks are
available in the Manufacturing, Trade & Service Section of the
Haver data base for Germany. This series combining wholesale
sales is not strictly comparable with the retail sales data and is
available only through June. The increase in passenger car
registrations is, perhaps, a better proxy for sales of new cars and
this series, which is not seasonally adjusted, is available through
July. It, too, can be found in the
Manufacturing, Trade & Services section in the Haver data base
on Germany. The year to year increases in these two series
are shown in the second chart. The year to year
increases in car registrations since January have been particularly
striking and suggest that consumers have a higher propensity to spend
than the retail sales data would suggest.
| Jul 09 | Jun 09 | Jul 08 | M/M % | Y/Y % | 2008 | 2007 | 2006 | |
|---|---|---|---|---|---|---|---|---|
| Retail Sales Volume (2005=100) | 94.9 | 94.2 | -5.9 | 0.74 | -1.04 | 96.5 | 97.2 | 1000.1 |
| Retail Sales Value (2005=100) | 99.1 | 99.0 | 101.4 | 0.10 | -2.27 | 101.4 | 99.4 | 100.9 |
| Retail Sales Implied Price Level (2005=100) | 104.4 | 105.1 | 105.7 | -0.64 | -1.24 | 105.1 | 102.2 | 100.9 |
| Year to Year % Change | Jul 09 | Jun 09 | May 09 | Apr 09 | Mar 09 | Feb 09 | Jan 09 | |
| Wholesale and Retail Sales of Cars and Light Motor Vehicles | n.a. | 8.59 | 7.23 | 0.75 | 23.70 | 5.38 | -15.89 | -- |
| New Passenger Car Registrations | 29.50 | 40.48 | 39.71 | 19.39 | 39.33 | 21.48 | -14.21 | -- |

Tom Moeller
AuthorMore in Author Profile »Prior to joining Haver Analytics in 2000, Mr. Moeller worked as the Economist at Chancellor Capital Management from 1985 to 1999. There, he developed comprehensive economic forecasts and interpreted economic data for equity and fixed income portfolio managers. Also at Chancellor, Mr. Moeller worked as an equity analyst and was responsible for researching and rating companies in the economically sensitive automobile and housing industries for investment in Chancellor’s equity portfolio. Prior to joining Chancellor, Mr. Moeller was an Economist at Citibank from 1979 to 1984. He also analyzed pricing behavior in the metals industry for the Council on Wage and Price Stability in Washington, D.C. In 1999, Mr. Moeller received the award for most accurate forecast from the Forecasters' Club of New York. From 1990 to 1992 he was President of the New York Association for Business Economists. Mr. Moeller earned an M.B.A. in Finance from Fordham University, where he graduated in 1987. He holds a Bachelor of Arts in Economics from George Washington University.
More Economy in Brief


