 Global| Oct 09 2007
Small Business Optimism Reduced by Credit Problems
by:Tom Moeller
|in:Economy in Brief
Summary
During September, small business optimism rose 1.0% from August after a 1.3% decline during that month. The level during September was 11% below the peak reached back in 2004, according to the National Federation of Independent [...]
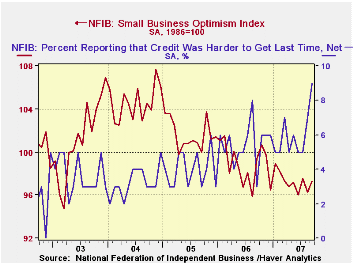
During September, small business optimism rose 1.0% from August after a 1.3% decline during that month. The level during September was 11% below the peak reached back in 2004, according to the National Federation of Independent Business (NFIB).
During the last ten years there has been a 70% correlation between the level of the NFIB index and the two quarter change in real GDP. The percentage of firms indicating that credit was more difficult to get rose to 9%, nearly double the recent low. Financial Stability and the Federal Reserve is a speech delivered this weekend by Federal Reserve Board GovernorKevin Warsh and it is available here.Internal Risk Models and the Estimation of Default Probabilities from the Federal Reserve Bank of San Francisco is available here.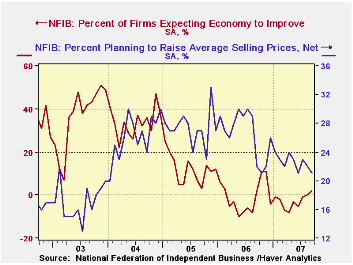
Respondents expecting the economy improved slightly to 2% and the percentage with one or more job openings was stable at 25%. During the last ten years there has been a 71% correlation between the NFIB percentage and the y/y change in nonfarm payrolls.
The percent planning to raise capital expenditures remained at a reduced 29%, down from the 2005 average of 32%..The percentage of firms planning to raise average selling prices fell to 21%, the lowest level since late 2005. The percentage of firms actually raising prices also fell to 9%, nearly its lowest level since 2004. During the last ten years there has been a 60% correlation between the change in the producer price index and the level of the NFIB price index.
About 24 million businesses exist in the United States. Small business creates 80% of all new jobs in America.
| Nat'l Federation of Independent Business | September | August | Y/Y | 2006 | 2005 | 2004 |
|---|---|---|---|---|---|---|
| Small Business Optimism Index (1986=100) | 97.3 | 96.3 | -2.1% | 98.9 | 101.6 | 104.6 |
by Tom Moeller October 9, 2007
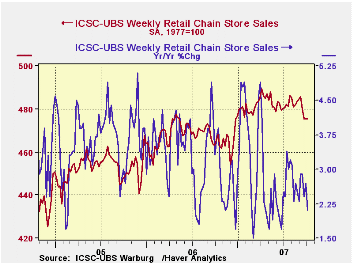
During the last ten years there has been a 45% correlation between the y/y change in chain store sales and the change in nonauto retail sales less gasoline.
The ICSC-UBS retail chain-store sales index is constructed using the same-store sales (stores open for one year) reported by 78 stores of seven retailers: Dayton Hudson, Federated, Kmart, May, J.C. Penney, Sears and Wal-Mart.
The leading indicator of chain store sales from ICSC-UBS fell 0.8% (-0.2% y/y) after a 0.2% decline during the prior week.Changing Productivity Trends from the Federal Reserve Bank of San Francisco can be found here.
| ICSC-UBS (SA, 1977=100) | 10/06/07 | 09/29/07 | Y/Y | 2006 | 2005 | 2004 |
|---|---|---|---|---|---|---|
| Total Weekly Chain Store Sales | 475.3 | 475.5 | 2.1% | 3.3% | 3.6% | 4.7% |
by Robert Brusca October 9, 2007
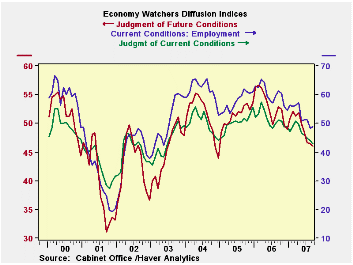
Economy watchers index at five year low.
Japan’s economy watcher’s index fell again for the six month running and extending a drop from a local peak reached back in March of 2006. The current future and employment indexes all are trending lower.The current economy watchers index and the employment components are at their five-year lows. The future index stands in the bottom 20% of its five-year range.
Japan’s economy continues to emit irregular signals despite ongoing statements of optimism from the BOJ.
| Key Japanese Surveys | |||||||
|---|---|---|---|---|---|---|---|
| Raw readings of each survey | Percent of 5Yr range* | ||||||
| Aug-07 | Jul-07 | Jun-07 | May-07 | Aug-07 | Jul-07 | Jun-07 | |
| Diffusion | |||||||
| Economy Watchers | 44.1 | 44.7 | 46.0 | 46.8 | 0.0% | 3.8% | 25.7% |
| Employment | 48.3 | 51.2 | 51.2 | 50.7 | 0.0% | 4.0% | 27.5% |
| Future | 46.5 | 46.7 | 48.4 | 50.0 | 19.8% | 21.4% | 34.9% |
| NTC MFG | 49.6 | 49.0 | 50.4 | 51.4 | 6.7% | 0.0% | 0.9% |
| Econ Trends (Teikoku'/50 neutral/weighted diffusion) | |||||||
| MFG | 44.2 | 44.5 | 44.6 | 45.2 | 55.7% | 63.2% | 69.7% |
| Retail | 38.3 | 37.9 | 39.2 | 39.6 | 39.6% | 37.0% | 52.7% |
| Wholesale | 41.2 | 41.3 | 42.1 | 42.8 | 51.1% | 56.6% | 68.0% |
| Services | 47.3 | 47.6 | 48.6 | 49.1 | 67.9% | 74.0% | 83.0% |
| Construction | 36.3 | 36.6 | 36.8 | 37.7 | 68.2% | 71.9% | 77.5% |
| 100 is high; zero is low | |||||||
by Louise Curley October 9, 2007
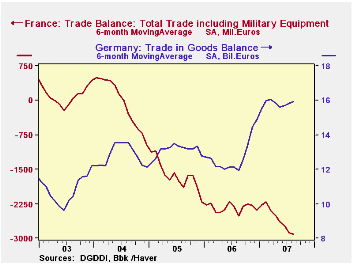
The balance of trade in goods in France improved from a deficit of 3.2 billion euros in July to 2.8 billion euros in August. In Germany, the surplus on trade in goods declined to 15.3 billion euros from 16.5 billion euros in July. Since month-to-month changes in the balance of trade in goods tend to be erratic, we calculated six-month averages (using the "advance functions" button) to get a better idea of the trends in the two balances. On this basis, the trend in France's balance of trade in goods appears to be still toward greater deficits, while the trend in Germany suggests that the recent rise in surpluses may be decelerating, as can be seen in the first chart.
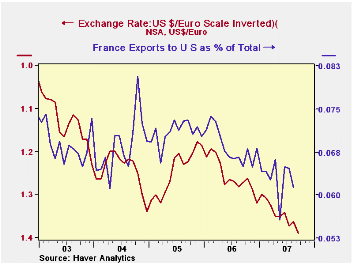
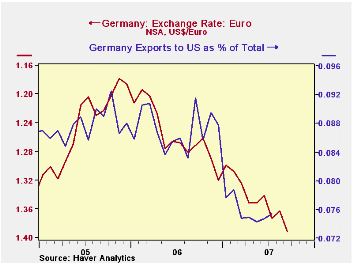
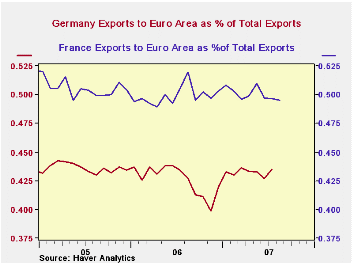
The rise in the Euro that began in late 2005 has led to a reduction in the portion of exports to the United States as can be seen in the second and third charts. These charts show the dollar value of the euro (scale inverted) and the portion of French and German exports to the United States. The relationship between the exchange rate and portion of exports appears to be closer in Germany than in France, but both show that an increase in the euro tends to dampen the portion of exports to the U. S. However, since exports to the US are a relatively small part of total exports in both countries, the impact on total exports has been small. The U. S. accounted for about 7% of total French exports in 2006. For Germany, the corresponding figure was about 9%. By far the most important buyers of French and German exports are other members of the Euro Area who are unaffected by changes in the currency. Over the past three years, between 40 and 45% of France's exports of goods and between 50 and 53% of Germany's exports of goods went to other members of the Euro Area, as shown in the fourth chart.
| TRADE IN GOODS--FRANCE AND GERMANY (Billions Euros) | Aug 07 | Jul 07 | Aug 06 | M/M Chg | Y/Y Chg | 2006 | 2005 | 2004 |
|---|---|---|---|---|---|---|---|---|
| FRANCE Balance | -2.8 | -3.2 | -3.0 | 0.4 | 0.2 | -27.6 | -22.7 | -5.0 |
| Total Exports | 34.7 | 34.0 | 32.5 | 2.0 | 6.6 | 389.6 | 357.5 | 340.9 |
| Exports to Euro Area | 17.2 | 16.9 | 16.9 | 1.7 | 1.6 | 194.4 | 180.7 | 173.9 |
| Exports to US | 2.1 | 2.2 | 2.1 | -3.2 | -1.8 | 26.4 | 25.1 | 23.0 |
| GERMANY Balance | 15.3 | 16.5 | 12.1 | -1.2 | 3.2 | 162.2 | 157.8 | 154.0 |
| Total Exports | 82.7 | 80.3 | 73.7 | 2.0 | 12.4 | 893.8 | 783.7 | 726.7 |
| Exports to Euro Area | 22.6 | 22.1 | 21.8 | -3.2 | -1.8 | 254.2 | 233.8 | 225.7 |
| Exports to US | n.a. | 6.1 | 6.3* | n.a.. | -4.0* | 78.0 | 68.8 | 94.1 |
| EXCHANGE RATE US$/Euro | 1.3626 | 1.3726 | 1.2810 | -0.7 | 6.4 | 1.2560 | 1.2447 | 1.2439 |
| *July 2006 n.a. not available | ||||||||

Tom Moeller
AuthorMore in Author Profile »Prior to joining Haver Analytics in 2000, Mr. Moeller worked as the Economist at Chancellor Capital Management from 1985 to 1999. There, he developed comprehensive economic forecasts and interpreted economic data for equity and fixed income portfolio managers. Also at Chancellor, Mr. Moeller worked as an equity analyst and was responsible for researching and rating companies in the economically sensitive automobile and housing industries for investment in Chancellor’s equity portfolio. Prior to joining Chancellor, Mr. Moeller was an Economist at Citibank from 1979 to 1984. He also analyzed pricing behavior in the metals industry for the Council on Wage and Price Stability in Washington, D.C. In 1999, Mr. Moeller received the award for most accurate forecast from the Forecasters' Club of New York. From 1990 to 1992 he was President of the New York Association for Business Economists. Mr. Moeller earned an M.B.A. in Finance from Fordham University, where he graduated in 1987. He holds a Bachelor of Arts in Economics from George Washington University.
More Economy in Brief


