 Global| Jan 06 2006
Shortfall in U.S. Payrolls Offset By Upward Revision
by:Tom Moeller
|in:Economy in Brief
Summary
Non-farm payrolls in December grew just 108,000. Nevertheless, when averaged with a November increase revised up to 305,000 from 215,000 reported initially, the gain was a sharp improvement from the prior two months' average of just [...]
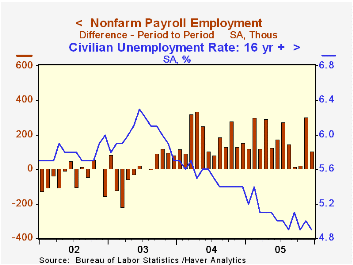
Non-farm payrolls in December grew just 108,000. Nevertheless, when averaged with a November increase revised up to 305,000 from 215,000 reported initially, the gain was a sharp improvement from the prior two months' average of just 21,000. Consensus expectations had been for a 200,000 increase in December. The average monthly increase in payrolls during 2005 was 179,300 versus 123,000 during 2004.
From the household survey the unemployment rate fell to 4.9%, a bit lower than expected. Employment rose 168,000 (1.9% y/y) after a 14,000 decline in November, revised shallower from the initial report. The labor force fell 30,000 (1.3% y/y).
Factory sector payrolls increased 18,000 (-0.4% y/y). The average gain in factory payrolls during the last three months of 13,000 is the best showing since mid-2004. An improvement in the industry breadth of gain during that period to 54.8% reflected gains in durable manufacturing but not nondurables.
Construction employment fell 9,000 (+3.5% y/y) following an upwardly revised 42,000 increase in November.
Private service producing payrolls rose a modest 82,000 (1.8% y/y) last month though the November increase was revised to 228,000 from 144,000. Retail trade jobs declined for the fourth month in the last five (+0.6% y/y) and job losses were widespread amongst industries. Education & health services jobs increased 25,000 (2.1% y/y) and remained on the earlier pace while professional & business services jobs rose 33,000(2.9% y/y). Jobs in financial services rose 12,000 (2.3% y/y) and leisure & hospitality rose 23,000 (1.9% y/y) and November's increase was revised up sharply.
Average hourly earnings were a bit stronger than expected, rising 0.3%, but the prior month's gain was lessened. Factory sector earnings rose just 0.1% (2.3% y/y) following no change in November.
Higher education and economic growth from the Federal Reserve Bank of Chicago can be found here.
| Employment | Dec | Nov | Y/Y | 2005 | 2004 | 2003 |
|---|---|---|---|---|---|---|
| Payroll Employment | 108,000 | 305,000 | 1.5% | 1.6% | 1.1% | -0.3% |
| Manufacturing | 18,000 | 8,000 | -0.4% | -0.3% | -1.2% | -4.9% |
| Average Weekly Hours | 33.7 | 33.8 | 33.7 (Dec '04) | 33.7 | 33.7 | 33.7 |
| Average Hourly Earnings | 0.3% | 0.1% | 3.1% | 2.8% | 2.1% | 2.7% |
| Unemployment Rate | 4.9% | 5.0% | 5.4% (Dec '04) | 5.1% | 5.5% | 6.0% |
by Tom Moeller January 6, 2006
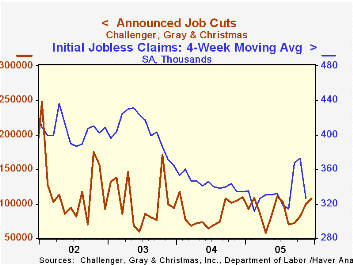
Challenger, Grey & Christmas reported that job cut announcements in December rose for the fourth consecutive month. The 8.6% rise versus November to 107,822 pulled the three month average of job cut announcements up to 96,134 (-8.6% y/y).
For the year, job cut announcement rose 3.1%, the first annual increase since 2001.
An increased level of job cuts in government dominated the December report. Declines in layoff announcements were widespread throughout other industries.
During the last ten years there has been an 84% (inverse) correlation between the three month moving average of announced job cuts and the three month change payroll employment.
Job cut announcements differ from layoffs. Many are achieved through attrition, early retirement or just never occur.
Challenger also reported a sharp m/m drop in announced hiring plans (102.1% y/y).
| Challenger, Gray & Christmas | Dec | Nov | Y/Y | 2005 | 2004 | 2003 |
|---|---|---|---|---|---|---|
| Announced Job Cuts | 107,822 | 99,279 | -1.3% | 1,072,054 | 1,039,935 | 1,236,426 |
by Carol Stone January 6, 2006
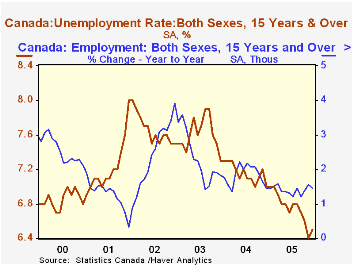
Canada's labor market was fairly firm in 2005, despite a modest reversal in employment for December, data for which were published this morning by Statistics Canada. In December, employment fell by 2,100 from November, but both November and October had good gains, so that Q4 as a whole added 97,000 jobs, the best since Q2 2004. Consequently, unemployment in Canada has come down. The 6.4% in November was the lowest since December 1974, with this December's 6.5% still the lowest since early 1975.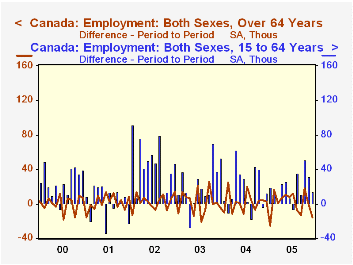
The age distribution of employment in December suggests that the slight reversal in total employment should have only limited overall economic impact. Jobs still increased in the major livelihood-earning segment, ages 15-64, with the decline more than accounted for among the elderly population. The former mid-range group increased in all but one month of 2005; the gains were not as large as in some months of the prior couple of years, but they were clearly steadier.
For the elderly population, the last four years have seen remarkable job growth accompanying a major increase in labor force participation. We can calculate a participation rate for the population over 65 and find that it has risen from 6% of that population in 2000 and 2001 to 8% in 2005. At the same time, the growth of that population group turned upward from a long, secular decline, bottoming at 1.56% in the year to January 2000 and reaching 2.17% in the year to December 2005. So the population is growing and so are employment opportunities for this age group. This process paused in November and December, but we'd surmise that it will resume soon.
| Canada (SA, Thous or %) |
Dec 2005 | Nov 2005 | Oct 2005 | Dec 2004 | 2005 | 2004 | 2003 |
|---|---|---|---|---|---|---|---|
| Employment, Age 15+ | 16,296 | 16,298 | 16,267 | 16,063 | 16,175 | 15,952 | 15,664 |
| -2 | 31 | 69 | 1.4% | 1.4% | 1.8% | 2.3% | |
| Age 15-64 | 15,988 | 15,974 | 15,943 | 15,763 | 15,868 | 15,664 | 15,393 |
| 14 | 31 | 51 | 1.4% | 1.3% | 1.8% | 2.1% | |
| Age 65+ | 307 | 323 | 324 | 300 | 307 | 287 | 271 |
| -16 | -1 | 18 | 2.4% | 6.8% | 5.9% | 13.8% | |
| Unemployment Rate, Age 15+ | 6.5% | 6.4% | 6.6% | 7.0% | 6.8% | 7.2% | 7.6% |
| Age 15-64 | 6.6% | 6.4% | 6.8% | 7.2% | 6.8% | 7.3% | 7.7% |

Tom Moeller
AuthorMore in Author Profile »Prior to joining Haver Analytics in 2000, Mr. Moeller worked as the Economist at Chancellor Capital Management from 1985 to 1999. There, he developed comprehensive economic forecasts and interpreted economic data for equity and fixed income portfolio managers. Also at Chancellor, Mr. Moeller worked as an equity analyst and was responsible for researching and rating companies in the economically sensitive automobile and housing industries for investment in Chancellor’s equity portfolio. Prior to joining Chancellor, Mr. Moeller was an Economist at Citibank from 1979 to 1984. He also analyzed pricing behavior in the metals industry for the Council on Wage and Price Stability in Washington, D.C. In 1999, Mr. Moeller received the award for most accurate forecast from the Forecasters' Club of New York. From 1990 to 1992 he was President of the New York Association for Business Economists. Mr. Moeller earned an M.B.A. in Finance from Fordham University, where he graduated in 1987. He holds a Bachelor of Arts in Economics from George Washington University.
More Economy in Brief


