 Global| May 21 2021
Service Sector Improvement Drives European PMIs Higher
Summary
The EMU PMI has a 90.6 percentile queue standing which tells us that the May composite value has been this high or higher 9.4% of the time since December of 2016. The percentile column places this month’s value in the high-low range [...]
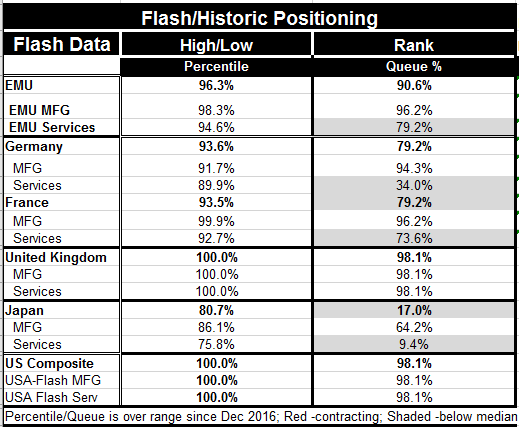
 The EMU PMI has a 90.6 percentile queue standing which tells us that the May composite value has been this high or higher 9.4% of the time since December of 2016. The percentile column places this month’s value in the high-low range over this period telling us that when the reading was at its highest this month’s reading is only 3.7% lower. Together these two pieces of information tell us that the PMI rating this month has rarely been higher and when it was it was not importantly higher that it is today. This is a very strong report for EMU.
EMU Member news Germany and France each have individual readings that are lower than the EMU readings. The queue standings for each country are much lower but the percentile standings are not ‘all that much ‘lower’ than for all of EMU, although they, too, are lower. The manufacturing sector readings are much closer to the EMU weighted averages for France and Germany. France is at parity with EMU for the most part in manufacturing while the German manufacturing sector is relatively weaker. However, for both the big shortfall is for services. The EMU services queue standing at the 79.2 percentile towers above the German standing of 34.0% and easily surpasses the French standing of 73.6%.
The UK and PMI values The United Kingdom is at period highs in its May readings. The high low rankings show us that since December of 2016 the diffusion readings for the UK are as high as they get. For the UK that is a composite reading of 60.0, a manufacturing reading of 66.1 and a services reading of 61.8. In EMU the composite reading is 56.9 in May compared to 56.2 in Germany and 57.0 in France. Manufacturing gauges were higher at 62.8 for EMU, Compare this to 64.0 for Germany and 59.2 for France, still all were below the UK’s 66.0 reading for manufacturing.
Japan Japan saw its overall composite weaken to indicate private sector contraction at 48.1. The headline fell from 51.0 to 48.1, below the breakeven reading of 50. Manufacturing in Japan slowed but still expanded at a diffusion reading of 52.5. The stumble came in the service sector where the contracting reading of 49.5 from April worsened to 45.7 in May as Japan set more business restrictions in place trying to control the spread of virus to make it safe to conduct the upcoming Olympics. Japan has the weakest by far composite standing at the 17th percentile. It is dragged down by a 9.4 percentile standing for services against a 64.3 percentile standing in manufacturing. However Japan’s manufacturing gauge was only 14% below its all-time best reading and its service sector reading- as low as it is in the queue of readings – was less 25% weaker than its best reading ever since 2016.
The United States Against that background the US data seem bulletproof. The US composite comes in at 68.0 with manufacturing at 61.5 and services at 70.1. The service sector is up sharply from its April reading. And the 70.1 percentile score seems odd since so many businesses are still impaired. Of course when a business goes from shut to slightly open its score can go from zero to ‘plus’ on the diffusion scale. The diffusion data seem to be putting really big PMI values on some initial improvement that might be much less than what the PMI signal seems to say. Much of what you read in the US is about how firms are having a hard time expanding because they can’t find the workers they need, for various reasons. This is just another reason to understand that PMI data are indicative in only the broadest of ways. The US composite and sectors are all at period high readings since 2016 and all with corresponding queue standings in their 98.1 percentiles since they ARE the strongest readings on this time line. The ramp up in the US services PMI is probably the most suspicious thing in the table for that reason. This is not the strongest US service sector since December of 2016 by a long shot yet the PMI gauge is the highest! Although the reading does communicate that the US service sector is improving. But since there are over 8 million people NOT back at work who had been at work pre-virus and since most of them were at work in the service sector DO NOT think that the US PMI value for May compares in any way to the service sector output data before the virus struck. The US data provide a good way to give you some perspective on what PMI data are and what they are not. PMI data measure the breadth of improvement period to period- not the strength. Bear that in mind.
What PMI data are and are not PMI data are not data generated by counting up employees, sales or orders. They are much simpler. Diffusion responses tell if a concept such as employment or orders rose, fell or was unchanged month-to-month. These sorts of data are indicative. The data can be useful or misleading. If a large number of firms all show very small increases in sales, sales could look very strong using the PMI approach and yet not be so strong when the actual numbers are developed. But if a few large firms had very large increases in sales the PMI might be weak while actual data could surge. Most of the time we find that counted up data and diffusion data track one another fairly well- but there are exceptions. We need to be vigilant about exceptions especially at a time like this when firms that were shuttered or on life-support are getting back in business. The value of the diffusion data is that it can be generated quickly. So use the data with perspective a pinch of salt and wary eye to what is going on in the real world.

Robert Brusca
AuthorMore in Author Profile »Robert A. Brusca is Chief Economist of Fact and Opinion Economics, a consulting firm he founded in Manhattan. He has been an economist on Wall Street for over 25 years. He has visited central banking and large institutional clients in over 30 countries in his career as an economist. Mr. Brusca was a Divisional Research Chief at the Federal Reserve Bank of NY (Chief of the International Financial markets Division), a Fed Watcher at Irving Trust and Chief Economist at Nikko Securities International. He is widely quoted and appears in various media. Mr. Brusca holds an MA and Ph.D. in economics from Michigan State University and a BA in Economics from the University of Michigan. His research pursues his strong interests in non aligned policy economics as well as international economics. FAO Economics’ research targets investors to assist them in making better investment decisions in stocks, bonds and in a variety of international assets. The company does not manage money and has no conflicts in giving economic advice.
More Economy in Brief


