 Global| Feb 28 2006
Second Estimate of Q4 05 GDP Shows Moderately Higher Growth: 1.6% (SAAR) vs 1.1%
Summary
Preliminary estimates, released today, now estimate growth of the U. S. economy in the fourth quarter of last year at a seasonally adjusted annual rate of 1.6% vs. the advance estimate 1.1% reported earlier. A third and final estimate [...]
Preliminary estimates, released today, now estimate growth of the U. S. economy in the fourth quarter of last year at a seasonally adjusted annual rate of 1.6% vs. the advance estimate 1.1% reported earlier. A third and final estimate will be released on March 30, at which time data on corporate profits will be available.
As Tom Moeller pointed out in his commentary on the "advance" estimate last month, the slow down in the fourth quarter was due in part to the collapse in the demand for autos which led to one of the smallest advances in consumer spending in the past four years and in part to the increasing foreign trade deficit.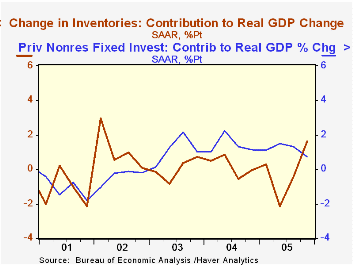
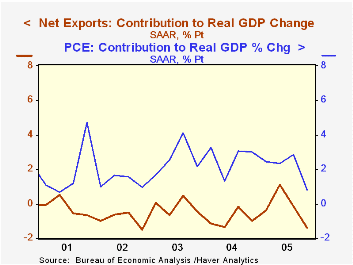
The current estimate shows that consumer spending accounted for only 0.81 points of the total 1.6 percentage point increase. In the past few years, the contribution had been generally over 2.0 percentage points. Fixed investment accounted for 0.73 points and inventories, by far the largest contributor, accounted for 1.62 points. A decline in government spending subtracted 0.13 points and the record trade deficit on goods and services subtracted 1.40 points.
The impacts on total growth from consumer spending and from foreign trade are shown in the first chart. The contribution from consumer spending declined in the fourth quarter to one of the lowest levels of the past five years.While foreign trade constitutes a drag on growth, more often than not, the impact of the fourth quarter trade deficit was one of the largest in the past five years. The contribution to growth from the business sector is shown in the second chart. While the contribution from fixed investment declined in the fourth quarter the contribution from inventory accumulation was up sharply.
| U.S. Gross Domestic Product (2000 Chained Dollars) | Q4 05 Preliminary | Q3 05 | Q2 05 | Q1 05 | 2005 | 2004 | 2003 | |
|---|---|---|---|---|---|---|---|---|
| Seasonally Adjusted Annual Rate of Growth | 1.6 | 4.1 | 3.3 | 3.5 | 3.5 | 4.2 | 2.7 | |
| Contribution to Growth | ||||||||
| Personal Consumption Expenditures | 0.81 | 2.85 | 2.35 | 2.44 | 2.49 | 2.71 | 2.05 | |
| Fixed Investment | 0.73 | 1.31 | 1.51 | 1.12 | 1.30 | 1.47 | 0.54 | |
| Inventories | 1.62 | -0.48 | -2.14 | 0.29 | -0.31 | 0.33 | 0.05 | |
| Net Exports | -1.40 | -0.12 | 1.00 | -0.40 | -0.29 | -0.73 | -0.46 | |
| Government Spending | -0.13 | 0.54 | 0.47 | 0.35 | 0.34 | 0.41 | 0.53 |
More Economy in Brief


