 Global| Aug 28 2006
Railcar Loadings, Truck Tonnage & Air Freight
by:Tom Moeller
|in:Economy in Brief
Summary
Railcar loadings through July grew 2.7% y/y, according to Atlantic Systems. Though y/y growth has been firm, the six month growth in loadings eased to 1.4% though some pickup may be evident in the weekly data for August. Intermodal [...]
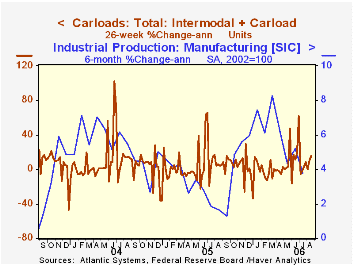
Railcar loadings through July grew 2.7% y/y, according to Atlantic Systems. Though y/y growth has been firm, the six month growth in loadings eased to 1.4% though some pickup may be evident in the weekly data for August.
Intermodal loadings (containers & trailers on flat cars) grew 5.4%. That rate of growth is roughly half the rate during 2004 and is down from 7.0% last year. Carload tonnage (which includes bulk shipping of materials) grew 0.8% y/y after a slight decline last year and 1.8% growth in 2004.
During the last ten years there has been a 37% correlation between the y/y growth in total freight car loadings and the change in factory production.
The truck tonnage index from the American Trucking Association fell 1.6% y/y during July. The index level improved some 3.0% from a low in March, but forward momentum has been constrained since last year's highs.
During the last ten years there has been a 44% correlation between the y/y growth in the truck tonnage index and the change in factory production.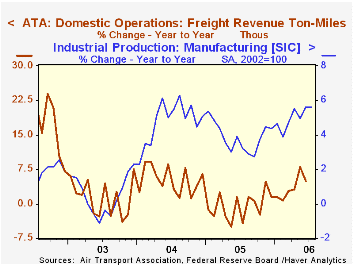
Air Freight Revenue Ton-Miles generated within the U.S. grew 5.0% y/y through June, according to the Air Transport Association. That growth is quite respectable but much of its strength owes to a favorable comparison to a weak period last year. The six-month growth rate of U.S. air-freight dropped to a negative 7.5%.
During the last ten years there has been a 38% correlation between the y/y growth in Air Freight and the change in factory production.
Chairman Ben S. Bernanke remarks at the Kansas City Fed's Annual Economic Symposium in Jackson Hole, Wyoming can be found here.
| U.S. Industry Statistics | July | June | May | 2005 | 2004 | 2003 |
|---|---|---|---|---|---|---|
| Railcar Loadings | 2.7% | 5.9% | 5.4% | 2.5% | 4.8% | 2.5% |
| Truck Tonnage Index | -1.6% | -1.1% | -1.2% | 2.3% | 5.9% | 3.0% |
| ATA Domestic Freight Revenue Ton-Miles | -- | 5.0% | 8.0% | -0.4% | 5.2% | 1.2% |
Tom Moeller
AuthorMore in Author Profile »Prior to joining Haver Analytics in 2000, Mr. Moeller worked as the Economist at Chancellor Capital Management from 1985 to 1999. There, he developed comprehensive economic forecasts and interpreted economic data for equity and fixed income portfolio managers. Also at Chancellor, Mr. Moeller worked as an equity analyst and was responsible for researching and rating companies in the economically sensitive automobile and housing industries for investment in Chancellor’s equity portfolio. Prior to joining Chancellor, Mr. Moeller was an Economist at Citibank from 1979 to 1984. He also analyzed pricing behavior in the metals industry for the Council on Wage and Price Stability in Washington, D.C. In 1999, Mr. Moeller received the award for most accurate forecast from the Forecasters' Club of New York. From 1990 to 1992 he was President of the New York Association for Business Economists. Mr. Moeller earned an M.B.A. in Finance from Fordham University, where he graduated in 1987. He holds a Bachelor of Arts in Economics from George Washington University.


