 Global| Nov 24 2009
Q3 GDP Growth Revised Down Due ToDomestic Demand & Foreign Trade
by:Tom Moeller
|in:Economy in Brief
Summary
The second estimate of 3Q U.S. economic growth was lowered from the advance report due to slower growth in domestic demand and greater deterioration in the foreign trade deficit. The revision to 2.4% from 3.5% was greater than [...]
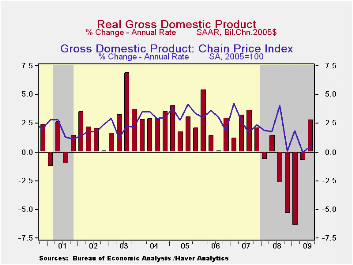 The second
estimate of 3Q U.S. economic growth was lowered from the advance report
due to slower growth in domestic demand and greater deterioration in
the foreign trade deficit. The revision to 2.4% from 3.5% was greater
than expectations for a lessening to 2.9%. Nevertheless, growth last
quarter was the first positive figure since 4Q 2007.
The second
estimate of 3Q U.S. economic growth was lowered from the advance report
due to slower growth in domestic demand and greater deterioration in
the foreign trade deficit. The revision to 2.4% from 3.5% was greater
than expectations for a lessening to 2.9%. Nevertheless, growth last
quarter was the first positive figure since 4Q 2007.
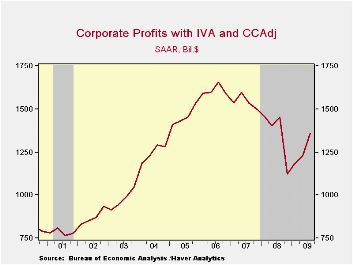 Accompanying
the GDP figure was the first estimate of 3Q corporate profits. The
10.6% rise versus 2Q was the third consecutive quarterly increase and
diminished the y/y decline to 6.7% from -25.1% at its worst in 4Q' 08.
Lower market interest rates lifted earnings in the financial sector by
more than one-third (25.4% y/y) and they tripled from year-end '08.
Earnings from the rest of the world increased 6.7% (-19.1% y/y) while
the end of the recession raised domestic nonfinancial profits by 2.0%
(-12.5% y/y) for the second quarterly increase.
Accompanying
the GDP figure was the first estimate of 3Q corporate profits. The
10.6% rise versus 2Q was the third consecutive quarterly increase and
diminished the y/y decline to 6.7% from -25.1% at its worst in 4Q' 08.
Lower market interest rates lifted earnings in the financial sector by
more than one-third (25.4% y/y) and they tripled from year-end '08.
Earnings from the rest of the world increased 6.7% (-19.1% y/y) while
the end of the recession raised domestic nonfinancial profits by 2.0%
(-12.5% y/y) for the second quarterly increase.
Deterioration in the foreign trade deficit subtracted a greater 0.8 percentage points from 3Q GDP growth after an initially estimated 0.5% subtraction. Import growth was increased to 20.8% (-14.1% y/y) yet the gain in exports also was revised up to 17.0% (-10.8% y/y).
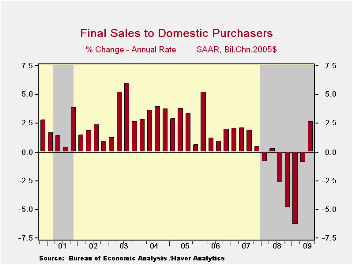
Domestic final demand growth also was revised down to 2.7% from 3.0%. Real PCE growth was revised down to 2.9% (-0.1% y/y) from 3.1% as the Cash for Clunkers sales program gave slightly less lift to vehicle sales as estimated earlier. Elsewhere, personal consumption of furniture grew at an unrevised 6.3% (-5.9% y/y) rate but the decline in spending on clothing & shoes was halved to 0.7% (-5.0% y/y). Services spending gained a slightly reduced 1.0% (0.4% y/y).
On the fixed-investment side of the GDP accounts, the quarterly rise in residential spending was slightly reduced to 19.5% (-18.8% y/y). Business investment also fell at a slightly increased 4.1% (-19.3% y/y) rate. Government investment rose at an increased 3.1% rate (2.0% y/y) led by an 8.9% gain in defense spending (5.2% y/y).
 The
addition to 3Q
growth in GDP from inventories was unchanged at 0.9 percentage points.
The addition followed subtractions of 1.4 and 2.4 percentage points
during the prior two quarters, and was just the second positive
contribution to GDP growth in two years.
The
addition to 3Q
growth in GDP from inventories was unchanged at 0.9 percentage points.
The addition followed subtractions of 1.4 and 2.4 percentage points
during the prior two quarters, and was just the second positive
contribution to GDP growth in two years.
The gain in the GDP price deflator was lowered slightly to 0.5%. The PCE price index was ticked lower to 2.7% (-0.7% y/y) and the rise in the overall domestic final sales price index was brought down to 1.5% (-1.0% y/y).· The U.S. National Income & Product Account data are available in Haver's USECON and the USNA databases.
Can the Term Spread Predict Output Growth and Recessions? A Survey of the Literature from the Federal Reserve Bank of St. Louis is available here.
| Chained 2005$, % AR | 3Q '09 Preliminary | 3Q '09 Advance | 2Q '09 | 1Q '09 | 2Q Y/Y | 2008 | 2007 | 2006 |
|---|---|---|---|---|---|---|---|---|
| GDP | 2.4 | 3.5 | -0.7 | -6.4 | -2.5 | 0.4 | 2.1 | 2.7 |
| Inventory Effect | 0.9 | 0.9 | -1.4 | -2.4 | -1.2 | -0.4 | -0.4 | 0.1 |
| Final Sales | 1.9 | 2.6 | 0.7 | -4.1 | -1.6 | 0.8 | 2.5 | 2.6 |
| Foreign Trade Effect | -0.8 | -0.5 | 1.7 | 2.6 | 0.8 | -1.2 | 0.8 | 0.1 |
| Domestic Final Demand | 2.7 | 3.0 | -0.9 | -6.4 | -2.4 | -0.4 | 1.7 | 2.5 |
| Chained GDP Price Index | 0.5 | 0.8 | -0.0 | 1.9 | 0.6 | 2.1 | 2.9 | 3.3 |
Case-Shiller Home Price Gains Slow After Three Months Of Strength
by Tom Moeller November 24, 2009
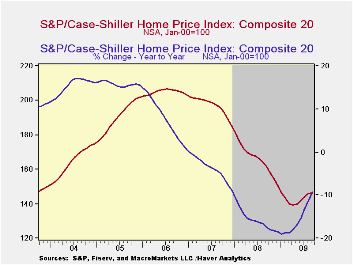 The rise in
home prices slowed with the recent plateau in home sales. The September
S&P/Case-Shiller Home Price Composite
Index of twenty metro-markets edged up 0.3% after an average 1.0% rise
during each of the prior three months. The latest increase lessened the
y/y decline to 9.4% from its worst of -19.0% in January. Consensus
expectations had been for a y/y decline of 9.1% for March. In addition,
prices were down by nearly one-third since the peak in May 2006. Not
seasonally adjusted prices rose 0.3% during September after a 1.2%
August increase.
The rise in
home prices slowed with the recent plateau in home sales. The September
S&P/Case-Shiller Home Price Composite
Index of twenty metro-markets edged up 0.3% after an average 1.0% rise
during each of the prior three months. The latest increase lessened the
y/y decline to 9.4% from its worst of -19.0% in January. Consensus
expectations had been for a y/y decline of 9.1% for March. In addition,
prices were down by nearly one-third since the peak in May 2006. Not
seasonally adjusted prices rose 0.3% during September after a 1.2%
August increase.
 The
Case-Shiller composite index of home prices in 10
metropolitan areas, which has a longer history and dates back to 1987,
also firmed last month by 1.0% (-10.7% y/y). This measure also is down
by nearly one-third since the 2006 peak.
The
Case-Shiller composite index of home prices in 10
metropolitan areas, which has a longer history and dates back to 1987,
also firmed last month by 1.0% (-10.7% y/y). This measure also is down
by nearly one-third since the 2006 peak.
The Case-Shiller index of 20 U.S. cities and their surrounding areas is value-weighted. A greater index weight is assigned to more expensive homes and the series dates back only to 2001. The S&P/Case-Shiller home price series can be found in Haver's USECON database and the city data highlighted below is in the REGIONAL database. The latest press release is available here . An overview of the S&P/Case-Shiller home price series can be found here.· Home prices in some areas of the country have firmed lately though they remain down year-to-year.
Prices in Chicago were quite firm for the third straight month and rose 1.1% (-10.7% y/y) and in San Francisco prices have been strong for five months (-7.9% y/y). In San Diego prices also were up solidly for the fourth month (-5.7% y/y) and prices in Minneapolis were quite strong for the last four months. However, they remain off 11.3% from one year ago. In Phoenix prices rose for the fourth straight month (-21.9% y/y). In Los Angeles home prices also were stronger and rose for the fourth month (-9.0% y/y).
The monthly S&P Case Shiller Home Price data can be found in Haver's USECON database and the regional data is available in the REGIONAL database.
Do Macroeconomic Announcements Move Inflation Forecasts? from the Federal Reserve Bank of St. Louis can be found here.
| S&P/Case-Shiller Home Price Index (SA, Jan 00 = 100) | September m/m | August m/m | July m/m | Sept. y/y | 2008 | 2007 | 2006 |
|---|---|---|---|---|---|---|---|
| 20 City Composite Index | 0.3% | 1.1% | 1.1% | -9.4% | -15.7% | -3.8% | 7.6% |
| Regional Indicators | |||||||
| Atlanta | 0.5 | 0.7 | 1.6 | -9.4 | -8.5 | 0.7 | 4.3 |
| Boston | -0.2 | 1.0 | 0.5 | -3.4 | -5.7 | -4.0 | -1.8 |
| Chicago | 1.1 | 1.3 | 2.0 | -10.7 | -10.0 | -1.0 | 6.6 |
| Dallas | -0.3 | 0.0 | 0.8 | -1.2 | -3.3 | 0.5 | 3.2 |
| Denver | 0.2 | 0.6 | 0.6 | -1.2 | -4.9 | -1.7 | 2.1 |
| Los Angeles | 0.7 | 1.2 | 1.2 | -9.0 | -24.2 | -5.2 | 11.6 |
| New York | -0.2 | 0.3 | 0.9 | -9.0 | -7.4 | -2.8 | 7.5 |
| San Francisco | 1.7 | 2.5 | 3.0 | -7.9 | -24.3 | -4.5 | 4.5 |
U.S. Consumer Confidence Gains M/M
by Tom Moeller November 24, 2009
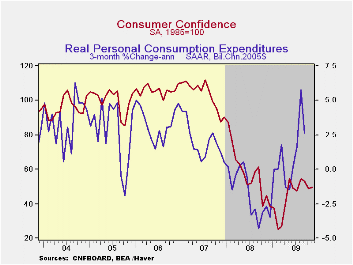 Consumers
were distressed this past winter. Malaise is the best word to describe
consumer confidence since then. The Conference Board indicated that
consumer confidence during November rose just 1.6% from October
following sharp declines during the prior five months. Though the level
of confidence is up sharply from this winter's low, it has moved
sideways since the spring. The Conference Board data can be found in
Haver's CBDB database.
Consumers
were distressed this past winter. Malaise is the best word to describe
consumer confidence since then. The Conference Board indicated that
consumer confidence during November rose just 1.6% from October
following sharp declines during the prior five months. Though the level
of confidence is up sharply from this winter's low, it has moved
sideways since the spring. The Conference Board data can be found in
Haver's CBDB database.
During the last ten years there has been an 86% correlation between the level of consumer confidence and the y/y change in real consumer spending.
Consumers' assessment of the current economic conditions slipped this month and was near the historic low. It remained off by almost two-thirds from one-year earlier. Jobs were seen as hard to get by 49.8% of respondents and jobs were seen as plentiful by only 3.2% which was near the series' historic low. Business conditions were seen as good by just 8.1% and that also was near the series' low. Consumers who thought business conditions were bad rose slightly to 45.7%. While off somewhat from its high, the reading was still nearly the highest since 1983.
 The
expectations component of confidence recovered a piece of its large
October decline and the index remained near the highest level since
late-2007. Fewer expected business conditions & employment to
improve but a large deterioration from here also was not expected.
Expectations for the inflation rate in twelve months held stable at
5.3%, the lowest level since 2007 and down from last year's high of
7.7%. Interest rates in twelve months were expected to be higher by
51.3% of respondents, while a reduced 12.9% expected rates to fall. A
greatly increased 36.3% of respondents expected stock prices to rise.
The
expectations component of confidence recovered a piece of its large
October decline and the index remained near the highest level since
late-2007. Fewer expected business conditions & employment to
improve but a large deterioration from here also was not expected.
Expectations for the inflation rate in twelve months held stable at
5.3%, the lowest level since 2007 and down from last year's high of
7.7%. Interest rates in twelve months were expected to be higher by
51.3% of respondents, while a reduced 12.9% expected rates to fall. A
greatly increased 36.3% of respondents expected stock prices to rise.
Consumers continued to manage their spending plans cautiously. A reduced 2.0% plan to buy a home during the next six months while just 23.2% plan to buy a major appliance. That's versus 30.9% back in 2007. Only 4.4% plan to buy an automobile versus 6.0% in 2007. Just 2.1% plan to buy a new one.
Housing's Great Fall: Putting Household Balance Sheets Back Together Again from the Federal Reserve Bank of St. Louis is available here.
| Conference Board (SA, 1985=100) | November | October | September | Y/Y % | 2008 | 2007 | 2006 |
|---|---|---|---|---|---|---|---|
| Consumer Confidence Index | 49.5 | 48.7 | 53.4 | 10.7 | 57.9 | 103.4 | 105.9 |
| Present Situation | 21.0 | 21.1 | 23.0 | -50.4 | 69.9 | 128.8 | 130.2 |
| Expectations | 68.5 | 67.0 | 73.7 | 48.3 | 50.0 | 86.4 | 89.7 |
Weekly Gasoline Prices Meander Sideways
by Tom Moeller November 24, 2009
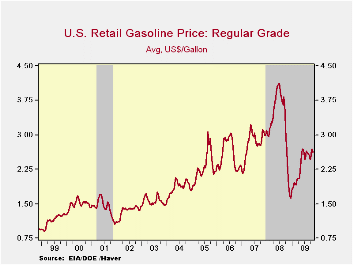
As they have since June, gasoline prices moved sideways last week. The pump price for regular gasoline of $2.64 per gallon was near $2.63 averaged during June. Nevertheless, prices remain up from the December low of $1.61. This week, wholesale gasoline prices fell from last week. The figures are reported by the U.S. Department of Energy and can be found in Haver's WEEKLY & DAILY databases.
Notwithstanding the stability of gasoline prices, crude oil prices have moved higher and light sweet crude (WTI) rose to an average $78.36 per barrel last week from $74.89 averaged last month and from the December low of $32.37. Yesterday, the spot market price for light sweet crude oil fell to $76.56 per barrel.
Behind the stabilization in gasoline prices is a leveling of past gains in gasoline demand. Last week, it posted a 1.1% decline versus one year ago versus a 3.9% increase as of last month. Demand for residual fuel oil increased 23.0% y/y while distillate demand fell 10.6% y/y.
Natural gas prices have declined during the last four weeks to an average $3.35 per mmbtu (-49.9% y/y). They remained down by two-thirds from the high reached in early-July of last year of $13.19/mmbtu.
| Weekly Prices | 11/23/09 | 11/16/09 | 11/09/09 | Y/Y | 2008 | 2007 | 2006 |
|---|---|---|---|---|---|---|---|
| Retail Regular Gasoline ($ per Gallon, Regular) | 2.64 | 2.63 | 2.67 | 39.5% | 3.25 | 2.80 | 2.57 |
| Light Sweet Crude Oil, WTI ($ per bbl.) | 78.36 | 78.21 | 79.04 | 49.7% | 100.16 | 72.25 | 66.12 |
Euro-Area Orders Continue To Claw Their Way Back
by Robert Brusca November 24, 2009

Euro-Area orders are still falling year-over-year. As the chart shows the Yr/Yr drop is being steadily mitigated. Both foreign-sourced orders and domestic orders (in-region orders) are rebounding smartly after their recession-induced drop.
Of the EU’s big four economies Germany and France are doing best with orders surging at stunningly strong 3- and 6-month rates of growth. Italy’s orders are still falling over both those periods as are orders in the UK. UK orders, in fact, are dropping at a horrific 31% annual rate in the three month period ended in Sept. demonstrating a severe drop off sparked by a 15.1% order drop in the month of August alone.
Needless to say the Euro-Area, while doing better, remains a very heterogeneous community. The orders rebound itself, is also not altogether uniform. The detailed figures revealed September's orders were driven by heavy transport equipment, such as ships, railway and aerospace equipment, which tend to be volatile. Excluding heavy transport equipment, orders dropped 1.2% from August and were 18.2% weaker than in September last year. Orders for intermediate goods dropped 2.1% in September from August, but orders for capital goods, durable consumer goods and nondurable consumer goods all rose.
On balance the orders trends show that the zone is doing better. As in the US a number of Zone economies did better on the back of government schemes to boost auto sales coupled with scrappage requirements; these programs are starting to lapse with some negative consequences for orders and growth.
For the time being though the Euro-Area is on the mend. The Markit PMIs showed that both MFG and Services sectors continued to improve in November. Germany’s IFO report showed continued improvement in November as well. The Markit data showed the rate of improvement is slowing down. The bottom line for now is that improvement continues but the pace of the recovery remains a keen issue and one on which incoming reports have not been altogether optimistic or uniform. The backtracking in the UK orders improvement and the slowdown in the November Markit indices’ improving trends are two recent pieces of disappointing data.
| Euro-Area-13 and UK Industrial Orders | |||||||||
|---|---|---|---|---|---|---|---|---|---|
| Saar except m/m | Mo/Mo | Sep 09 | Aug 09 | Sep 09 | Aug 09 | Sep 09 | Aug 09 | ||
| Ezone Detail | Sep-09 | Aug-09 | Jul-09 | 3-Mo | 3-Mo | 6-mo | 6-mo | 12-mo | 12-mo |
| MFG Orders | 1.5% | 0.6% | 4.4% | 29.0% | 35.8% | 23.6% | 19.1% | -16.5% | -23.2% |
| Memo:MFG | |||||||||
| Total Orders | 1.5% | 0.6% | 4.4% | 29.0% | 35.8% | 23.6% | 19.1% | -16.5% | -23.2% |
| E-13 Domestic MFG orders | 6.5% | -3.2% | 5.1% | 38.3% | 40.3% | 22.4% | 5.4% | -13.4% | -21.4% |
| E-13 Foreign MFG orders | 7.3% | -5.0% | 5.0% | 31.1% | 32.8% | 26.3% | 13.9% | -17.3% | -24.9% |
| Countries: | Sep-09 | Aug-09 | Jul-09 | 3-Mo | 3-Mo | 6-mo | 6-mo | 12-mo | 12-mo |
| Germany (MFG): | 1.5% | 2.5% | 2.0% | 26.9% | 40.6% | 29.8% | 35.0% | -16.7% | -24.2% |
| France(Ind): | 5.7% | 2.9% | 4.7% | 67.4% | 42.3% | 33.8% | 6.0% | -5.6% | -14.0% |
| Italy (Ind): | 5.2% | -8.6% | 2.4% | -5.8% | -16.5% | -3.8% | -16.4% | -21.4% | -29.5% |
| UK (Engineering Industy): | 2.3% | -15.1% | 4.7% | -31.7% | -26.0% | -3.0% | -3.5% | -30.9% | -13.1% |
Business Confidence In Germany And France
by Louise Curley November 24, 2009
 Overall
business confidence in Germany and in France improved slightly in
November. Confidence in both countries, however, is still
subdued.
Overall
business confidence in Germany and in France improved slightly in
November. Confidence in both countries, however, is still
subdued.
In Germany, confidence is measured in two
ways: (1) as a percent difference between the optimists and the
pessimists regarding a particular question and (2) as an index based on
the percent differences with the year 2000=100. Although the
excess of pessimists over optimists regarding the current situation
continued to decline in November, there was still a significant excess,
25.1%. Germans have been much less pessimistic regarding the
outlook six months ahead and in November there was actually a small,
0.2%, excess of optimists over pessimists on the outlook. The
overall climate indicator, which is a combination of present conditions
and future expectations, improved but still showed an excess of
pessimists over optimists, 12.9%. (The percent balances
between the optimists and pessimists for the three indicators are shown
in the first chart.)
The
overall climate indicator, which is a combination of present conditions
and future expectations, improved but still showed an excess of
pessimists over optimists, 12.9%. (The percent balances
between the optimists and pessimists for the three indicators are shown
in the first chart.)
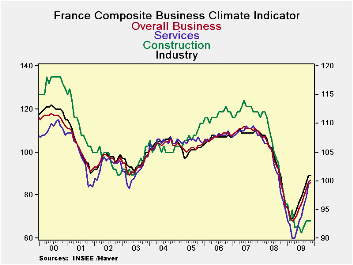
In France, the measures of confidence
are so constructed by INSEE (Institute National de la Statistiques et
des Etudes Economiques) that the long term averages are equal to
100. In November, all the indexes: overall confidence at 87,
confidence in the construction industry at 93, industry at 89 and
services at 86 are still below their long term averages. (The French
business confidence indicators are shown in the second
chart.)  INSEE also publishes turning point indicators that
attempt to detect at the earliest possible moment turning points of the
business cycle. The series tracks the difference between the
probability that the economy is growing versus the probability that it
is contracting and is evaluated between +1 and -1.
A value of +1 indicates that the economy is growing strongly, and one
of -1 indicates that the economy is contracting sharply. A
value close to zero indicates an economy near to its long term average
and is neither growing nor contracting significantly.
(Turning points for the Composite and the Industry Survey Indicators
are shown in the third chart.) The Composite turning point
indicator has been at +1 now for five months, indicating continuing
recovery. The turning point indicator for the Industry Survey, however,
has been falling and in November was negative, suggesting at least some
deceleration of activity in this sector. The November Climate
indicator for Industry was 89, unchanged from October, after a run of
seven increases since March of this year.
INSEE also publishes turning point indicators that
attempt to detect at the earliest possible moment turning points of the
business cycle. The series tracks the difference between the
probability that the economy is growing versus the probability that it
is contracting and is evaluated between +1 and -1.
A value of +1 indicates that the economy is growing strongly, and one
of -1 indicates that the economy is contracting sharply. A
value close to zero indicates an economy near to its long term average
and is neither growing nor contracting significantly.
(Turning points for the Composite and the Industry Survey Indicators
are shown in the third chart.) The Composite turning point
indicator has been at +1 now for five months, indicating continuing
recovery. The turning point indicator for the Industry Survey, however,
has been falling and in November was negative, suggesting at least some
deceleration of activity in this sector. The November Climate
indicator for Industry was 89, unchanged from October, after a run of
seven increases since March of this year.
| GERMANY IFO % Balance | Nov 09 | Oct 09 | Sep 09 | Aug 09 | Jul 08 | Jun 09 | May 09 | Apr 09 | Mar 09 |
|---|---|---|---|---|---|---|---|---|---|
| Current Conditions | -25.1 | -28.6 | -29.1 | -30.8 | -34.3 | -38.1 | -34.9 | -36.0 | -37.7 |
| Expectations | 0.2 | -3.9 | -6.0 | -7.5 | -16.6 | -18.4 | -25.5 | -29.7 | -34.6 |
| Overall Climate | -12.7 | -16.7 | -17.9 | -19.5 | -25.7 | -28.5 | -31.8 | -32.9 | -36.1 |
| FRANCE Business Confidence (LT Avg =100) | |||||||||
| Services | 86 | 85 | 79 | 75 | 70 | 68 | 64 | 60 | 60 |
| Construction | 93 | 93 | 93 | 92 | 91 | 92 | 92 | 92 | 95 |
| Industry | 89 | 89 | 86 | 82 | 79 | 77 | 74 | 71 | 69 |
| Composite | 87 | 86 | 83 | 79 | 76 | 74 | 71 | 69 | 68 |
| FRANCE Turning Points | |||||||||
| Industry | -0.3 | 0.6 | 0.5 | 0.8 | 0.8 | 0.9 | 0.6 | 0.4 | -1.0 |
| Composite | 1.0 | 1.0 | 1.0 | 1.0 | 1.0 | 0.1 | -0.6 | -0.7 | -0.9 |

Tom Moeller
AuthorMore in Author Profile »Prior to joining Haver Analytics in 2000, Mr. Moeller worked as the Economist at Chancellor Capital Management from 1985 to 1999. There, he developed comprehensive economic forecasts and interpreted economic data for equity and fixed income portfolio managers. Also at Chancellor, Mr. Moeller worked as an equity analyst and was responsible for researching and rating companies in the economically sensitive automobile and housing industries for investment in Chancellor’s equity portfolio. Prior to joining Chancellor, Mr. Moeller was an Economist at Citibank from 1979 to 1984. He also analyzed pricing behavior in the metals industry for the Council on Wage and Price Stability in Washington, D.C. In 1999, Mr. Moeller received the award for most accurate forecast from the Forecasters' Club of New York. From 1990 to 1992 he was President of the New York Association for Business Economists. Mr. Moeller earned an M.B.A. in Finance from Fordham University, where he graduated in 1987. He holds a Bachelor of Arts in Economics from George Washington University.
More Economy in Brief


