 Global| Aug 27 2009
Q2 GDP Unrevised on Net at 1.0% Fall; Hesitant Profits Recovery Continues
Summary
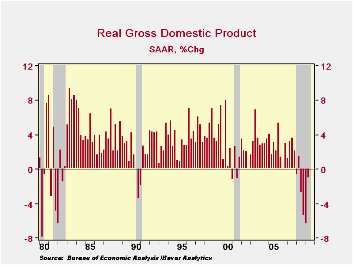
The pace of real GDP change was unchanged in today's report from the Commerce Department, which showed a 1.0% rate of decline. Inventories were revised lower but offset in the GDP tally by a smaller decline in domestic final sales and [...]
 The pace of
real GDP change was unchanged in today's report from the Commerce
Department, which showed a 1.0% rate of decline. Inventories
were revised lower but offset in the GDP tally by a smaller decline in
domestic final sales and a larger push from net exports than were
reported in the July release. Notably, these latter two
revisions put total final sales up at a 0.4% rate, the first quarterly
increase in a year.
The pace of
real GDP change was unchanged in today's report from the Commerce
Department, which showed a 1.0% rate of decline. Inventories
were revised lower but offset in the GDP tally by a smaller decline in
domestic final sales and a larger push from net exports than were
reported in the July release. Notably, these latter two
revisions put total final sales up at a 0.4% rate, the first quarterly
increase in a year.
This GDP report marks the initiation of new nomenclature by the Commerce Department for the order of the GDP releases. Formerly, the "advance" report was followed by the "preliminary". Now the report after the "advance" is called "second release" and will be followed next month by the "third release". Surely this is an improvement for the last here, formerly known as "final", but which was revised soon enough yet again in annual and comprehensive revisions, so it was hardly "final".
Among categories of
demand, revisions were generally modest and favorable.
Consumer spending is now estimated to have fallen at a 1.0% annual rate
compared to 1.2% before and residential investment is down at a 22.8%
pace instead of 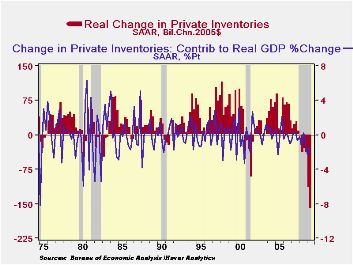 the 29.3% reported earlier. Exports were
revised to a 5.0% decline from 7.0% before, and government consumption
and gross investment was increased to 6.4% growth from 5.6%.
On the downside, nonresidential investment was lowered to a 10.9% rate
of decline from 8.9% reported before, with the cut coming from
structures; equipment outlays were lifted a bit. Imports
remained down at a 15.1% rate, as goods imports were "more weak" and
service imports were "less weak".
the 29.3% reported earlier. Exports were
revised to a 5.0% decline from 7.0% before, and government consumption
and gross investment was increased to 6.4% growth from 5.6%.
On the downside, nonresidential investment was lowered to a 10.9% rate
of decline from 8.9% reported before, with the cut coming from
structures; equipment outlays were lifted a bit. Imports
remained down at a 15.1% rate, as goods imports were "more weak" and
service imports were "less weak".
The inventory reductions are even more impressive than they were in the earlier report. Previously seen at $141.1 billion SAAR in chained 2005 dollars, the new data show them at -$159.2 billion. Every major stage of distribution cut stocks sharply: manufacturers, wholesalers and retailers. We often attribute such major adjustments to the auto industry, and it certainly participated, but durable and nondurable goods wholesalers and "other" retailers also reduced their merchandise on hand. This said, the contribution of inventory change to the GDP decline was not as severe, 1.4%, as it had been in Q1, 2.4%.
One
reason to cut inventories -- and labor forces, for that matter -- is to
cut costs. The performance of profits indicates that progress
has been made on this front. Corporate profits in Q2 rose
5.7% pre-tax, including IVA and CCAdj, from Q1 and were below Q2 2008
by "just" 10.9%. The year-to-year movement in Q1 had been
-19.0% with -25.1% in Q4. By broad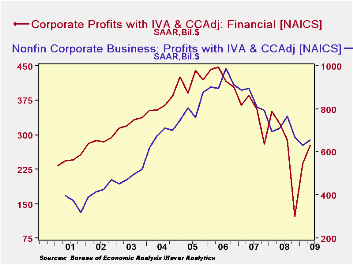 sector, financial industries saw their quarterly profits gain 16.7% in
Q2 from Q1; they had nearly doubled from Q4 to Q1, gaining
95.1%. On a year-to-year basis, financial company profits are
still down, with Q2 at -14.3%; on this 4-quarter trend, profits have
declined continuously since Q3 2006. Nonfinancial company
profits have contracted less consistently, although they continued a
quarter-to-quarter decline in Q1, down 6%. Q2 saw a partial
reversal to an increase 4.5%. The year-to-year trend remains
down, by 7.7% in Q2; this has been negative since Q2 2007.
Thus, these operating profits are beginning to recover, but with such
hesitation that might not yet inspire much confidence.
sector, financial industries saw their quarterly profits gain 16.7% in
Q2 from Q1; they had nearly doubled from Q4 to Q1, gaining
95.1%. On a year-to-year basis, financial company profits are
still down, with Q2 at -14.3%; on this 4-quarter trend, profits have
declined continuously since Q3 2006. Nonfinancial company
profits have contracted less consistently, although they continued a
quarter-to-quarter decline in Q1, down 6%. Q2 saw a partial
reversal to an increase 4.5%. The year-to-year trend remains
down, by 7.7% in Q2; this has been negative since Q2 2007.
Thus, these operating profits are beginning to recover, but with such
hesitation that might not yet inspire much confidence.
The
U.S. National Income & Product Account data are available in
Haver's USECON and the USNA
databases.
| Chained 2005$, % AR | 2Q '09 (2nd Release) | 2Q '09 (Advance) | 1Q '09 | 2Q Y/Y | 2008 | 2007 | 2006 |
|---|---|---|---|---|---|---|---|
| GDP | -1.0 | -1.0 | -6.4 | -3.9 | 0.4 | 2.1 | 2.7 |
| Inventory Effect | -1.4 | -0.8 | -2.4 | -1.0 | -0.4 | -0.4 | 0.1 |
| Final Sales | 0.4 | -0.2 | -4.1 | -2.9 | 0.8 | 2.5 | 2.6 |
| Foreign Trade Effect | 1.6 | 1.4 | 2.6 | 0.9 | -1.2 | 0.8 | 0.1 |
| Domestic Final Demand | -1.2 | -1.5 | -6.4 | -3.8 | -0.4 | 1.7 | 2.5 |
| Chained GDP Price Index | 0.0 | 0.2 | 1.9 | 1.5 | 2.1 | 2.9 | 3.3 |
Carol Stone, CBE
AuthorMore in Author Profile »Carol Stone, CBE came to Haver Analytics in 2003 following more than 35 years as a financial market economist at major Wall Street financial institutions, most especially Merrill Lynch and Nomura Securities. She had broad experience in analysis and forecasting of flow-of-funds accounts, the federal budget and Federal Reserve operations. At Nomura Securities, among other duties, she developed various indicator forecasting tools and edited a daily global publication produced in London and New York for readers in Tokyo. At Haver Analytics, Carol was a member of the Research Department, aiding database managers with research and documentation efforts, as well as posting commentary on select economic reports. In addition, she conducted Ways-of-the-World, a blog on economic issues for an Episcopal-Church-affiliated website, The Geranium Farm. During her career, Carol served as an officer of the Money Marketeers and the Downtown Economists Club. She had a PhD from NYU's Stern School of Business. She lived in Brooklyn, New York, and had a weekend home on Long Island.
More Economy in Brief


