 Global| May 27 2004
Q1 2004 GDP Revised Up Slightly, Corporate Profit Growth Slowed
by:Tom Moeller
|in:Economy in Brief
Summary
US real GDP growth in 1Q was revised slightly higher to 4.4% (AR) from the advance report of 4.2% growth. The Consensus expectation was for a revision to 4.5% growth. Growth in operating earnings slowed. Before tax corporate profits [...]
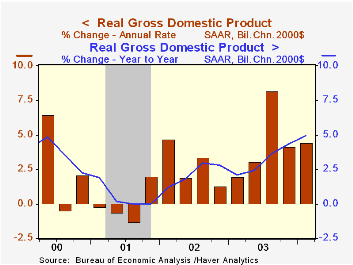
US real GDP growth in 1Q was revised slightly higher to 4.4% (AR) from the advance report of 4.2% growth. The Consensus expectation was for a revision to 4.5% growth.
Growth in operating earnings slowed. Before tax corporate profits with inventory valuation adjustment (IVA) & capital consumption adjustment (CCA) dropped to 4.9% (AR, 31.6% y/y) from the barnburner growth rates of 32.3%, 46.0% and 48.1% during the prior three quarters. After tax operating earnings grew 5.6% (AR) last quarter.
Operating profits for nonfinancial corporations grew 3.6% (AR, 37.7% y/y). Profit margins at nonfinancial corporations did not grow last quarter as indicated by an unchanged level of operating earnings per unit real value added. Nevertheless, margins were about two thirds higher than in 2001.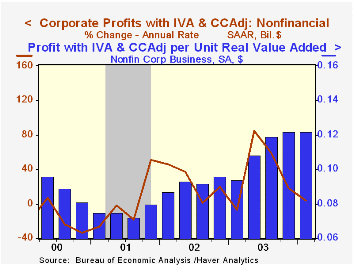
"Recent Revisions to Corporate Profits: What We Know and When We Knew It" from the Federal Reserve Bank of New York is available here.
Personal consumption expenditures growth was little changed at 3.9% (4.3% y/y) rate. Durables spending fell 4.2% due to lower light vehicle sales but nondurables grew 6.6% and services were up 4.2%.
Nonresidential fixed investment growth was revised higher to 9.8% (AR, 12.5% y/y) from 7.2%. Investment in equipment & software was revised to 17.0% (19.4% y/y) from 11.4%. Residential investment growth also was revised up to 3.8% (9.3% y/y) from 2.1%.
Additional investment in inventories is now estimated to have added 0.8 percentage points to GDP growth, up from the initial estimate of a 0.3% add.
The trade sector, however, is now estimated to have subtracted 0.4 percentage points from GDP growth as imports were revised up to 5.9% (AR, 7.9% y/y) from 2.0%. Export growth of 4.9% (8.3% y/y) was a little better than first estimated.
Inflation was little revised at 2.6% for the chain price index. The gain in the PCE chain price index actually was revised down to 3.0% (1.6% y/y) from 3.2%. Business equipment & software prices were revised up to a 0.2% decline (0.0% y/y) from -0.5%.
"Technology, Globalization, and Economic Policy" from the Federal Reserve Bank of St. Louis can be found here.
| Chained 2000$, % AR | 1Q '04 (Prelim.) | 1Q '04 (Advance) | 4Q '03 (Final) | Y/Y | 2003 | 2002 | 2001 |
| GDP | 4.4% | 4.2% | 4.1% | 5.0% | 3.1% | 2.2% | 0.5% |
| Inventory Effect | 0.8% | 0.3% | 0.7% | 0.2% | -0.1% | 0.4% | -0.9% |
| Final Sales | 3.7% | 3.9% | 3.4% | 4.7% | 3.2% | 1.8% | 1.4% |
| Trade Effect | -0.4% | 0.0% | -0.3% | 0.0% | -0.2% | -0.6% | -0.2% |
| Domestic Final Demand | 3.9% | 3.7% | 3.6% | 4.8% | 3.4% | 2.4% | 1.6% |
| Chained GDP Price Index | 2.6% | 2.5% | 1.5% | 1.7% | 1.7% | 1.5% | 2.4% |
| Chained 2000$, % AR | 1Q '04 (Prelim.) |
1Q '04 (Advance) |
4Q '03 (Final) |
Y/Y | 2003 | 2002 | 2001 |
|---|---|---|---|---|---|---|---|
| GDP | 4.4% | 4.2% | 4.1% | 5.0% | 3.1% | 2.2% | 0.5% |
| Inventory Effect | 0.8% | 0.3% | 0.7% | 0.2% | -0.1% | 0.4% | -0.9% |
| Final Sales | 3.7% | 3.9% | 3.4% | 4.7% | 3.2% | 1.8% | 1.4% |
| Trade Effect | -0.4% | 0.0% | -0.3% | 0.0% | -0.2% | -0.6% | -0.2% |
| Domestic Final Demand | 3.9% | 3.7% | 3.6% | 4.8% | 3.4% | 2.4% | 1.6% |
| Chained GDP Price Index | 2.6% | 2.5% | 1.5% | 1.7% | 1.7% | 1.5% | 2.4% |
by Tom Moeller May 27, 2004
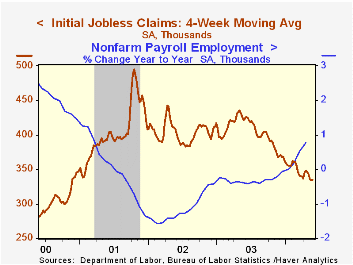
Initial claims for jobless insurance dipped 3,000 last week to 344,000 following the 14,000 increase during the prior week that was revised up slightly. Consensus expectations had been for 335,000 initial claims.
The 4-week moving average of initial claims ticked up to 335,500 (-20.3% y/y).
Continuing claims for unemployment insurance rose 19,000 following a 30,000 decline the prior week that was deeper than originally estimated.
The insured rate of unemployment was unchanged at 2.3% where it has been for four weeks.
| Unemployment Insurance (000s) | 5/22/04 | 5/15/04 | Y/Y | 2003 | 2002 | 2001 |
|---|---|---|---|---|---|---|
| Initial Claims | 344 | 347 | -17.9% | 403 | 404 | 406 |
| Continuing Claims | -- | 2,943 | -19.8% | 3,533 | 3,573 | 3,023 |
by Tom Moeller May 27, 2004
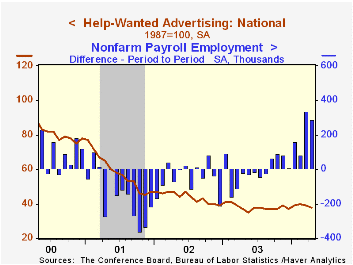
The Conference Board’s National Index of Help-Wanted Advertising fell for the second month to 38 from 39 in March and from 40 in February.
The decline runs counter to the improvement in hiring portended by the Manpower Employment Outlook Survey for 2Q04. During the last ten years there has been a 74% correlation between the help wanted index and the Manpower Survey.
There has been a 93% correlation between the level of help-wanted advertising and the year-to-year change in non-farm payrolls.
The proportion of labor markets with rising want-ad volume recovered some of the slump in March and rose to 43% from 22%.
The Conference Board surveys help-wanted advertising volume in 51 major newspapers across the country every month.
| Conference Board | April | Mar | April '03 |
|---|---|---|---|
| National Help Wanted Index | 38 | 39 | 37 |

Tom Moeller
AuthorMore in Author Profile »Prior to joining Haver Analytics in 2000, Mr. Moeller worked as the Economist at Chancellor Capital Management from 1985 to 1999. There, he developed comprehensive economic forecasts and interpreted economic data for equity and fixed income portfolio managers. Also at Chancellor, Mr. Moeller worked as an equity analyst and was responsible for researching and rating companies in the economically sensitive automobile and housing industries for investment in Chancellor’s equity portfolio. Prior to joining Chancellor, Mr. Moeller was an Economist at Citibank from 1979 to 1984. He also analyzed pricing behavior in the metals industry for the Council on Wage and Price Stability in Washington, D.C. In 1999, Mr. Moeller received the award for most accurate forecast from the Forecasters' Club of New York. From 1990 to 1992 he was President of the New York Association for Business Economists. Mr. Moeller earned an M.B.A. in Finance from Fordham University, where he graduated in 1987. He holds a Bachelor of Arts in Economics from George Washington University.
More Economy in Brief


