 Global| Jan 14 2004
Producer Prices Rose, Core Index Fell
by:Tom Moeller
|in:Economy in Brief
Summary
Finished producer prices rose 0.3% in December and reversed the prior month's 0.3% decline. Consensus expectations had been for a 0.2% gain. For 2003 the PPI rose 3.2%, the largest increase since 2000. Core producer prices fell 0.1% [...]
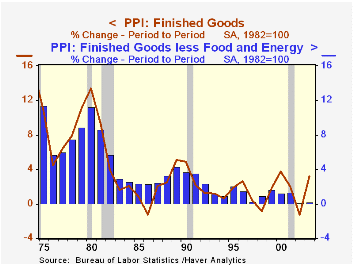
Finished producer prices rose 0.3% in December and reversed the prior month's 0.3% decline. Consensus expectations had been for a 0.2% gain. For 2003 the PPI rose 3.2%, the largest increase since 2000.
Core producer prices fell 0.1% in December for the second consecutive month versus expectations for a 0.1% rise. The 0.2% gain in core prices during all of 2003 barely outpaced the prior year's gain of 0.1%.
Finished consumer goods prices rose 0.4% in December (5.1% y/y) and reversed the 0.4% November drop. Less food & energy finished consumer goods prices fell 0.1% (+1.0% Y/Y).
Finished capital goods prices fell by 0.1% for the second consecutive month (+0.9% y/y).
Finished energy prices rose 1.8% (11.4% y/y). Gasoline prices (14.9% y/y) and fuel oil prices (13.9% y/y) were strong. These energy product price series are NSA.
Intermediate goods prices rose 0.5% as energy prices rose. Core intermediate prices rose just 0.1%, but the annual gain of 2.0% reversed the deflation of the prior two years.
Crude goods prices surged 2.0%. Energy prices jumped 4.3% (44.5% for the full year). Core crude prices also were strong, up 3.4%. Iron & steel scrap prices jumped 10.2% (62.5% y/y).
| Producer Price Index | Dec | Nov | Y/Y | 2003 | 2002 | 2001 |
|---|---|---|---|---|---|---|
| Finished Goods | 0.3% | -0.3% | 4.0% | 3.2% | -1.3% | 2.0% |
| Core | -0.1% | -0.1% | 0.9% | 0.2% | 0.1% | 1.4% |
| Intermediate Goods | 0.5% | -0.2% | 3.8% | 4.7% | -1.5% | 0.4% |
| Core | 0.1% | 0.2% | 2.1% | 2.0% | -0.5% | -0.1% |
| Crude Goods | 2.0% | 0.2% | 18.6% | 25.1% | -10.6% | 0.3% |
| Core | 3.4% | 4.3% | 21.1% | 12.2% | 3.8% | -10.0% |
by Tom Moeller January 14, 2004
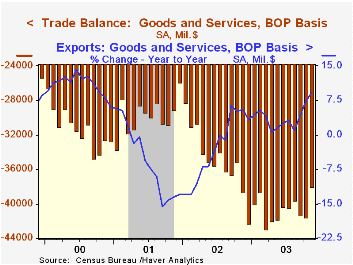
The U.S. foreign trade deficit narrowed unexpectedly in November to $38.0B, the smallest deficit in over a year.
Exports surged 2.9% (9.3% y/y) for the sixth strong gain in seven months. Exports of capital goods jumped 6.5% (12.0% y/y) and nonauto consumer goods exports surged 7.3% (12.7% Y/Y).
Imports fell unexpectedly the value of petroleum imports dropped 8.3% (+8.5% y/y) on lower volumes. Capital goods imports rose 0.8% (5.3% y/y) but nonauto consumer goods imports fell 0.8% (4.8% y/y).
By country, the US trade deficit with China narrowed sharply to $10.8B as exports surged 53.8% y/y). The US trade deficit with the European Union also narrowed to $7.4B.
| Foreign Trade | Nov | Oct | Y/Y | 2002 | 2001 | 2000 |
|---|---|---|---|---|---|---|
| Trade Deficit | $38.0B | $41.6B | $38.6B(11/02) | $418.0B | $357.8B | $375.4B |
| Exports - Goods & Services | 2.9% | 2.8% | 9.3% | -3.3% | -5.8% | 10.8% |
| Imports - Goods & Services | -0.8% | 2.1% | 5.8% | 2.0% | -5.5% | 17.8% |
by Tom Moeller January 14, 2004

The index of mortgage applications compiled by the Mortgage Bankers Association jumped 17.1% last week (-39.1% y/y) to the highest level in over a month.
The effective interest rate on a conventional 30-Year mortgage slid to 5.84% from 6.10% the prior week and versus 5.97% averaged last year. The effective rate on a 15-year mortgage also fell to 5.19% from 5.38% averaged during 2003.
Applications to refinance surged 25.1% w/w but were well off last year's level (-62.1% y/y).
Analysis titled "After the Refinancing Boom: Will Consumers Scale Back Their Spending?" from the Federal Reserve Bank of New York is available here.
Purchase applications also surged, by 11.1% w/w (+24.6% y/y).
During the last ten years there has been a 54% correlation between the y/y change in purchase applications and the change in new plus existing home sales.
The Mortgage Bankers Association surveys between 20 to 35 of the top lenders in the U.S. housing industry to derive its refinance, purchase and market indexes. The weekly survey accounts for more than 40% of all applications processed each week by mortgage lenders. Visit the Mortgage Bankers Association site here.
| MBA Mortgage Applications (3/16/90=100) | 1/09/04 | 1/02/03 | 2003 | 2002 | 2001 |
|---|---|---|---|---|---|
| Total Market Index | 702.6 | 599.9 | 1,067.9 | 799.7 | 625.6 |
| Purchase | 445.9 | 401.3 | 395.1 | 354.7 | 304.9 |
| Refinancing | 2,195.7 | 1,755.4 | 4,981.8 | 3,388.0 | 2,491.0 |

Tom Moeller
AuthorMore in Author Profile »Prior to joining Haver Analytics in 2000, Mr. Moeller worked as the Economist at Chancellor Capital Management from 1985 to 1999. There, he developed comprehensive economic forecasts and interpreted economic data for equity and fixed income portfolio managers. Also at Chancellor, Mr. Moeller worked as an equity analyst and was responsible for researching and rating companies in the economically sensitive automobile and housing industries for investment in Chancellor’s equity portfolio. Prior to joining Chancellor, Mr. Moeller was an Economist at Citibank from 1979 to 1984. He also analyzed pricing behavior in the metals industry for the Council on Wage and Price Stability in Washington, D.C. In 1999, Mr. Moeller received the award for most accurate forecast from the Forecasters' Club of New York. From 1990 to 1992 he was President of the New York Association for Business Economists. Mr. Moeller earned an M.B.A. in Finance from Fordham University, where he graduated in 1987. He holds a Bachelor of Arts in Economics from George Washington University.
More Economy in Brief


