 Global| Dec 13 2002
Producer Prices Fall
by:Tom Moeller
|in:Economy in Brief
Summary
Finished producer prices were weaker than expected last month and fell 0.4%. Consensus expectations were for no change. It was the first decline in prices since July. Excluding food and energy prices also were weaker than expectations [...]
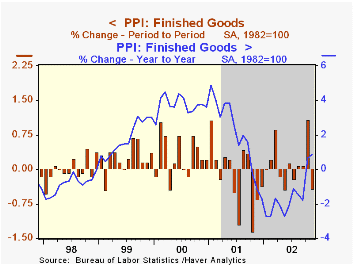
Finished producer prices were weaker than expected last month and fell 0.4%. Consensus expectations were for no change. It was the first decline in prices since July.
Excluding food and energy prices also were weaker than expectations for no change. The 0.3% decline similarly was the first drop since July. Core producer prices were down 0.1% (AR, YTD).
Finished energy prices fell for the first month since June (11.6% AR, YTD). Gasoline prices fell 11.6% (54.1% AR), reversing all of the prior month's jump, and fuel oil prices slumped 10.7% (45.1% AR, YTD). Residential gas prices also were strong for the second consecutive month (8.1% AR, YTD). These energy product price series are NSA.
Core finished consumer goods prices fell 0.3% (0.2% AR, YTD). Consumer durables prices fell 0.7% and reversed all of the October jump as prices for passenger cars and household appliances fell. Other consumer durables prices were tame. Core nondurable goods prices rose 0.1% (1.3% AR, YTD. Capital goods prices fell 0.2% (-0.5% AR, YTD) as computer prices continued to decline.
Food prices rose 0.3%, but it was only the second monthly rise since mid-year.
Intermediate goods prices fell for the first month since February as energy prices fell. Core intermediate prices rose just 0.1% for the third consecutive month (1.8% AR, YTD).
Crude goods prices were again strong (26.0% AR, YTD) reflecting higher energy prices. Other commodities prices reflected in the core crude price measure were strong reflecting higher scrap copper and aluminum prices. Steel scrap prices fell sharply for the second consecutive month.
| Producer Price Index | Nov | Oct | Y/Y | 2001 | 2000 | 1999 |
|---|---|---|---|---|---|---|
| Finished Goods | -0.4% | 1.1% | 0.9% | 2.0% | 3.7% | 1.8% |
| Core | -0.3% | 0.5% | 0.1% | 1.4% | 1.3% | 1.7% |
| Intermediate Goods | -0.1% | 0.7% | 2.4% | 0.4% | 4.9% | 0.1% |
| Core | 0.1% | 0.1% | 1.4% | -0.1% | 2.6% | -0.3% |
| Crude Goods | 5.1% | 3.4% | 14.7% | 0.3% | 22.8% | 1.5% |
| Core | 0.4% | 0.9% | 11.6% | -9.9% | 7.3% | -4.7% |
by Tom Moeller December 13, 2002
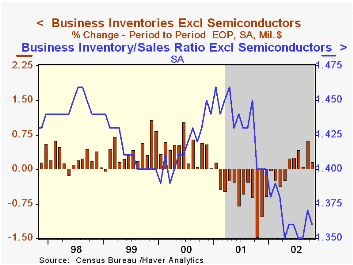
Total business inventories rose as expected in October. September's gain in inventories was revised up slightly due to raised figures for retail inventories.
Retail inventories (7.4% YTD, AR) were strong for the second consecutive month led by a 3.0% jump in motor vehicle inventories, the second strong gain in a row.
Nonauto retail inventories (1.8% YTD, AR) fell for the first monthly decline since March. Inventories of furniture & home furnishings were unchanged following earlier strength (10.1% YTD, AR). Inventories at apparel stores slumped 1.2% (1.7% YTD, AR). At general merchandise stores inventories rose a modest 0.2% (-0.9% YTD, AR) for the second consecutive month.
Overall business sales rose 0.4% (4.2% YTD, AR).
The inventory-to-sales ratio fell slightly to 1.36 from an upwardly revised September level.
| Business Inventories | Oct | Sept | Y/Y | 2001 | 2000 | 1999 |
|---|---|---|---|---|---|---|
| Total | 0.2% | 0.6% | -0.6% | -6.3% | 5.6% | 5.4% |
| Retail | 0.7% | 1.3% | 5.3% | -5.0% | 6.1% | 7.7% |
| Retail excl. Autos | -0.4% | 0.7% | 0.7% | -2.0% | 4.1% | 5.7% |
| Wholesale | -0.3% | 0.4% | -3.0% | -5.5% | 6.6% | 6.0% |
| Manufacturing | 0.0% | 0.2% | -4.4% | -8.0% | 4.5% | 3.1% |
by Tom Moeller December 13, 2002
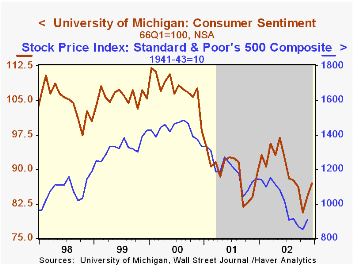
The preliminary December reading of Consumer Sentiment from the University of Michigan rose more than Consensus expectations for a rise to 85.0. Sentiment has rebounded 7.9% during the last two months.
Indexes of current conditions and expectations both rose.
Over the last 10 years there has been a 40% correlation between the annual change in consumer sentiment and the change in stock prices.That correlation rose to 62% during the last five years
The University of Michigan survey is not seasonally adjusted.
| University of Michigan | Prelim. Dec | Nov | Y/Y | 2001 | 2000 | 1999 |
|---|---|---|---|---|---|---|
| Consumer Sentiment | 87.0 | 84.2 | -2.0% | 89.2 | 107.6 | 105.8 |

Tom Moeller
AuthorMore in Author Profile »Prior to joining Haver Analytics in 2000, Mr. Moeller worked as the Economist at Chancellor Capital Management from 1985 to 1999. There, he developed comprehensive economic forecasts and interpreted economic data for equity and fixed income portfolio managers. Also at Chancellor, Mr. Moeller worked as an equity analyst and was responsible for researching and rating companies in the economically sensitive automobile and housing industries for investment in Chancellor’s equity portfolio. Prior to joining Chancellor, Mr. Moeller was an Economist at Citibank from 1979 to 1984. He also analyzed pricing behavior in the metals industry for the Council on Wage and Price Stability in Washington, D.C. In 1999, Mr. Moeller received the award for most accurate forecast from the Forecasters' Club of New York. From 1990 to 1992 he was President of the New York Association for Business Economists. Mr. Moeller earned an M.B.A. in Finance from Fordham University, where he graduated in 1987. He holds a Bachelor of Arts in Economics from George Washington University.
More Economy in Brief


