 Global| May 15 2003
Producer Prices Down a Record Amount
by:Tom Moeller
|in:Economy in Brief
Summary
Finished producer prices fell 1.9% in April, a record decline for any one month. Consensus expectations were for a 0.6% decline. Lower finished energy prices, down 8.6%, accounted for much of the decline in the overall PPI. Gasoline [...]

Finished producer prices fell 1.9% in April, a record decline for any one month. Consensus expectations were for a 0.6% decline.
Lower finished energy prices, down 8.6%, accounted for much of the decline in the overall PPI. Gasoline prices fell 16.8% (12.7% y/y) following three months of strong gain. Fuel oil prices fell 27.7% (21.4% y/y). Residential gas prices dropped 4.0% (27.9% y/y). These energy product price series are NSA.
Excluding food and energy prices fell 0.9%, more than expectations for a -0.1% drop.
Core finished consumer goods prices fell 1.3% (-0.4% y/y). The decline was the largest since August 1993 and very much reflected the 8.4% drop in tobacco prices. Passenger car prices also fell 2.6% (-0.5% y/y). Many other durable consumer goods prices either rose slightly or were unchanged. Capital goods prices fell 0.5% (0.1% y/y).
Intermediate goods prices dropped sharply and the unchanged reading for core intermediate prices was the weakest of this year.
Crude goods prices plunged 16.3%, a record decline for one month. Finished energy prices were off by almost one third but a 1.3% decline in core crude prices was the steepest since November 2001 and reflected declines in a broad range of commodity prices, mostly metals.
| Producer Price Index | April | Mar | Y/Y | 2002 | 2001 | 2000 |
|---|---|---|---|---|---|---|
| Finished Goods | -1.9% | 1.5% | 2.4% | -1.3% | 2.0% | 3.7% |
| Core | -0.9% | 0.7% | -0.2% | 0.1% | 1.4% | 1.3% |
| Intermediate Goods | -2.2% | 2.0% | 4.8% | -1.5% | 0.4% | 4.9% |
| Core | 0.0% | 0.2% | 2.4% | -0.5% | -0.1% | 2.6% |
| Crude Goods | -16.3% | 13.3% | 18.0% | -10.6% | 0.3% | 22.8% |
| Core | -1.3% | 1.0% | 11.4% | 3.8% | -10.0% | 7.4% |
by Tom Moeller May 15, 2003
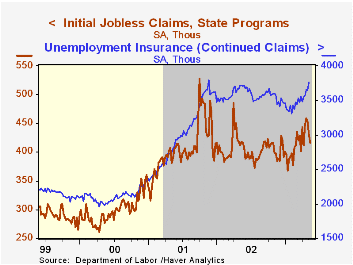
Initial claims for unemployment insurance fell slightly more than Consensus expectations for a decline to 425,000. Initial claims fell 3.0% w/w to 417,000. That added to a 5.1% decline the week earlier which was revised shallower. It was the third consecutive weekly decline which has totaled 9.2%.
The four-week moving average of initial claims fell to a still high 439,750 (5.4% y/y).
During the last ten years there has been an 81% (inverse) correlation between the level of initial jobless insurance claims and the y/y change in real GDP.
Continuing claims for unemployment insurance rose 3.3% w/w to the highest level since mid-November, 2001. The prior week's figure was revised down.
The insured rate of unemployment rose to 3.0%, again the highest level since mid-November, 2001.
| Unemployment Insurance (000s) | 5/10/03 | 5/03/03 | Y/Y | 2002 | 2001 | 2000 |
|---|---|---|---|---|---|---|
| Initial Claims | 417.0 | 430.0 | -0.2% | 404.3 | 406.0 | 299.7 |
| Continuing Claims | -- | 3,770 | 1.3% | 3,575 | 3,022 | 2,114 |
by Tom Moeller May 15, 2003

Industrial production fell about as expected last month. The 0.5% decline was the second in a row and versus Consensus expectations for a 0.4% decline. Revisions to prior months' data were small.
Output in the manufacturing sector fell 0.6% (-0.7% y/y) and that added to modest 0.1% declines in the prior two months.
Higher output in selected high-technology industries, up 1.0% (9.3% y/y), offset declines in other industries. Excluding high-tech, factory output fell 0.7% (-1.3% y/y) in April following two months of 0.2% decline. Motor vehicle output fell sharply for the third straight month.
Output of consumer goods fell 0.5% (-0.9% y/y) as appliance output was flat and nondurable consumer goods output was down for the second month.
Total capacity utilization fell sharply to 74.4%, the lowest level since June 1983. Factory sector utilization also fell to 72.5%, the lowest level since mid-1983.
| Production & Capacity | April | Mar | Y/Y | 2002 | 2001 | 2000 |
|---|---|---|---|---|---|---|
| Industrial Production | -0.5% | -0.5% | -0.4% | -0.8% | -3.5% | 4.7% |
| Capacity Utilization | 74.4% | 74.8% | 75.6%(4/02) | 75.6% | 77.3% | 82.7% |
by Tom Moeller May 15, 2003
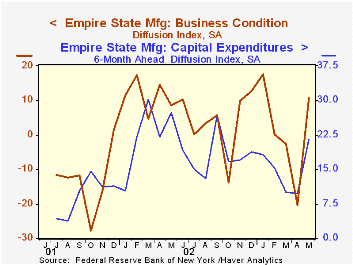
The Empire State Manufacturing Survey index of general business conditions jumped 30 points and improved to 10.60. That was the first positive reading since February. The data were reported by the Federal Reserve Bank of New York. Consensus expectations for a reading of -2.0.
Diffusion indexes for all the subgroups improved with orders, shipments and employment each moving into positive territory and thus suggesting positive growth.
The index of prices paid fell sharply to 13.98 and reversed virtually all of the prior month's rise.
The survey includes measures of business expectations six months ahead. This diffusion index for general business conditions rose sharply to 55.61 led by improved expectations for new orders, shipments and employment. Expectations for capital expenditures surged to the highest level since last September.
The Empire State Manufacturing Survey is a monthly survey of manufacturers in New York State conducted by the Federal Reserve Bank of New York. Participants from across the state in a variety of industries respond to a questionnaire and report the change in a variety of indicators from the previous month. Respondents also state the likely direction of these same indicators six months ahead. April 2002 is the first report, although survey data date back to July 2001.
Like the Philadelphia Fed Index of General Business Conditions, the Empire State Business Conditions Index reflects answers to an independent survey question, not the components.
For the latest Empire State Manufacturing Survey report, click here.
| Empire State Manufacturing Survey | May | April | Y/Y | 2002 | 2001 |
|---|---|---|---|---|---|
| General business conditions (diffusion index) | 10.60 | -20.20 | 8.66 | 7.10 | -13.02 |
by Tom Moeller May 15, 2003
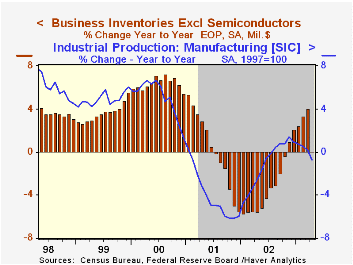
Total business inventories again rose twice Consensus expectations. In March, inventories rose 0.4% versus expectations for a 0.2% gain. The turn to accumulation began early last year and has bolstered output in the factory sector.
Retail inventories rose sharply as they have since early last year. Inventories of motor vehicles and parts again surged and are up 20.1% y/y.
Nonauto retail inventories rose by 0.6% for the third month in four. Inventories at apparel stores rose 0.7% (7.4% y/y) for the fifth month of strong gain. Inventories at general merchandise stores jumped 1.2% (4.0% y/y). Inventories of furniture, home furnishings and electronics fell for the third consecutive month (4.3% y/y).
Overall business sales jumped 1.8% (5.6% y/y), following the 0.9% decline in February, led by across the board gains.
The inventory-to-sales ratio fell to 1.38 from an upwardly revised 1.40 in February.
| Business Inventories | Mar | Feb | Y/Y | 2002 | 2001 | 2000 |
|---|---|---|---|---|---|---|
| Total | 0.4% | 0.7% | 4.0% | 2.1% | -5.4% | 5.4% |
| Retail | 0.8% | 1.1% | 9.1% | 7.6% | -2.9% | 6.0% |
| Retail excl. Autos | 0.6% | 0.6% | 4.1% | 2.5% | -1.2% | 3.7% |
| Wholesale | 0.5% | 0.3% | 2.2% | 0.4% | -4.9% | 6.1% |
| Manufacturing | -0.0% | 0.4% | 0.4% | -1.9% | -8.0% | 4.5% |
by Tom Moeller May 15, 2003
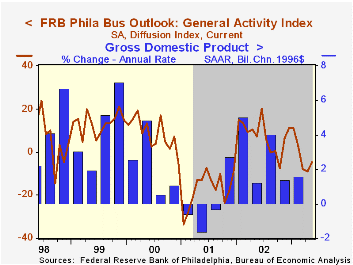
The Philadelphia Fed’s index of general business conditions improved about as expected in May to -4.8 from -8.8 in April. Consensus expectations were for improvement to -4.0.
The decline contrasts with the much sharper rise in the Empire State Factory survey for May reported earlier today.
Amongst the sub indexes new orders, shipments, and employment each improved modestly but remained negative.
During the last twenty years there has been a 68% correlation between the level of the Philadelphia Fed Business Conditions Index and quarterly growth in real GDP. The correlation with quarterly growth in factory sector industrial production has been 80%.
The business conditions index reflects a separate survey question, not the components.
A separate survey of expected business conditions eased slightly for the second month to 45.2 versus 50.9 last year and 32.4 in 2001.
The prices paid index fell sharply to 8.9, the lowest level since April of last year.
The Philadelphia Fed index is based on a survey of 250 regional manufacturing firms, but these firms sell nationally and internationally.
The latest Business Outlook survey from the Philadelphia Fed can be found here.
| Philadelphia Fed Business Outlook | May | April | Y/Y | 2002 | 2001 | 2000 |
|---|---|---|---|---|---|---|
| General Activity Index | -4.8 | -8.8 | 7.3 | 7.7 | -17.2 | 8.3 |
| Prices Paid Index | 8.9 | 22.8 | 16.5 | 12.2 | -0.9 | 27.2 |
by Tom Moeller May 15, 2003

The National Association of Home Builders Housing Market Index moved moderately higher in May. The rise recovered a part of the sharp decline earlier this year.
The index of current market conditions rose to highest level since February. The index which measures expected sales in six months surged to about its high level of 2002.
Traffic of prospective buyers rose sharply and recovered much of the decline of the prior two months.
The NAHB index is a diffusion index based on a survey of builders. Readings above 50 signal that more builders view conditions as good than poor.
For a description of the housing market index from the National Association of Home Builders, visit the NAHB website.
| Nat'l Association of Home Builders | May | April | Y/Y | 2002 | 2001 | 2000 |
|---|---|---|---|---|---|---|
| Composite Housing Market Index | 56 | 52 | 60 | 61 | 56 | 62 |

Tom Moeller
AuthorMore in Author Profile »Prior to joining Haver Analytics in 2000, Mr. Moeller worked as the Economist at Chancellor Capital Management from 1985 to 1999. There, he developed comprehensive economic forecasts and interpreted economic data for equity and fixed income portfolio managers. Also at Chancellor, Mr. Moeller worked as an equity analyst and was responsible for researching and rating companies in the economically sensitive automobile and housing industries for investment in Chancellor’s equity portfolio. Prior to joining Chancellor, Mr. Moeller was an Economist at Citibank from 1979 to 1984. He also analyzed pricing behavior in the metals industry for the Council on Wage and Price Stability in Washington, D.C. In 1999, Mr. Moeller received the award for most accurate forecast from the Forecasters' Club of New York. From 1990 to 1992 he was President of the New York Association for Business Economists. Mr. Moeller earned an M.B.A. in Finance from Fordham University, where he graduated in 1987. He holds a Bachelor of Arts in Economics from George Washington University.
More Economy in Brief


