 Global| Sep 19 2006
PPI Up 0.1%, Core Prices Fell
by:Tom Moeller
|in:Economy in Brief
Summary
The finished goods producer price index increased 0.1% in August, the same as in July and below Consensus expectations for a 0.2% rise.Excluding food & energy finished producer prices were similarly under control last month and [...]
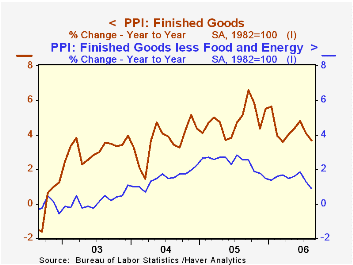
The finished goods producer price index increased 0.1% in August, the same as in July and below Consensus expectations for a 0.2% rise.Excluding food & energy finished producer prices were similarly under control last month and unexpectedly fell 0.4% after a 0.3% drop in July. Expectations had been for a 0.2% increase in the core PPI.
Finished consumer goods prices less food & energy dropped 0.5% (+0.7% y/y) as passenger car prices dropped 2.6% (-5.4% y/y). Capital equipment prices also fell by 0.3% (+1.0% y/y) for the second consecutive monthly decline as light truck prices fell 3.4% (-7.5% y/y). Prices of pumps, compressors & equipment were, however, strong and posted a 0.6% (3.7% y/y) increase.
Finished energy goods prices posted a 0.3% (13.1% y/y) August gain as . residential natural gas prices rose 1.6% (5.2% y/y) and residential electric power costs increased 1.3% (7.4% y/y). Gasoline prices fell 2.2% (+20.9% y/y) though fuel oil prices rose 0.7% (25.1% y/y).
Intermediate goods prices posted another strong increase and rose 0.4%. The gain reflected a like 0.4% rise in prices less food & energy.
The crude materials PPI again was strong posting a 2.2% increase led by a 15.7% (NSA, -9.2% y/y) gain in natural gas. Less food & energy crude goods prices fell 2.8% led lower by a 14.7% (+20.1% y/y) drop in iron & steel scrap prices. Aluminum base scrap prices also were weak last month and fell 4.6% (+30.1% y/y).
The Internationalization of the Dollar and Trade Balance Adjustment from the Federal Reserve Bank of New York is available here.
| Producer Price Index | August | July | Y/Y | 2005 | 2004 | 2003 |
|---|---|---|---|---|---|---|
| Finished Goods | 0.1% | 0.1% | 3.6% | 4.9% | 3.6% | 3.2% |
| Core | -0.4% | -0.3% | 0.9% | 2.4% | 1.5% | 0.2% |
| Intermediate Goods | 0.4% | 0.5% | 8.7% | 8.0% | 6.6% | 4.7% |
| Core | 0.4% | 0.7% | 8.3% | 5.5% | 5.7% | 2.0% |
| Crude Goods | 2.2% | 3.1% | 5.4% | 14.6% | 17.5% | 25.1% |
| Core | -2.8% | 1.3% | 25.2% | 4.8% | 26.5% | 12.4% |
by Tom Moeller September 19, 2006
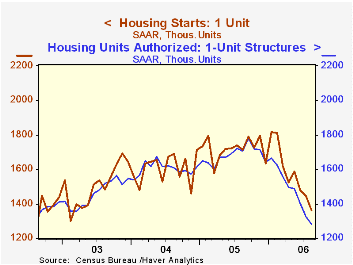
Housing starts in August fell hard for the sixth month this year to 1.665M units. The 6.0% m/m decline outpaced Consensus expectations for a drop to 1.75M, lowered starts 19.8% below last August and left the latest level 26.5% below the series' peak reached this past January.
Single-family starts fell 5.9% last month to 1.36M, off 25.0% from the January peak while multi family starts dropped 6.7% for the third straight monthly decline.
By region single family housing starts in the West fell 4.4% m/m (-33.4% y/y) and in the Midwest starts fell 12.9% (-28.7% y/y). Single family starts in the South also fell by 6.1% (-9.9% y/y) but in the Northeast starts rose for the second consecutive month after a one-third drop during June (-19.3% y/y).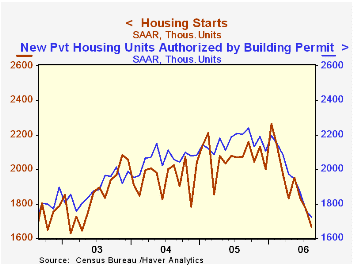
Building permits fell for the seventh consecutive month, off 2.3%. Permits to start singe family homes were even weaker and fell 3.5% (-25.0% y/y).
Beyond Neighborhood Revitalization from the Federal Reserve Bank of Boston can be found here.
| Housing Starts (000s, AR) | August | July | Y/Y | 2005 | 2004 | 2003 |
|---|---|---|---|---|---|---|
| Total | 1,665 | 1,772 | -19.8% | 2,073 | 1,950 | 1,854 |
| Single-family | 1,360 | 1,445 | -20.6% | 1,719 | 1,604 | 1,505 |
| Multi-family | 305 | 327 | -15.7% | 354 | 345 | 349 |
| Building Permits | 1,722 | 1,763 | -21.9% | 2,159 | 2,058 | 1,888 |
by Tom Moeller September 19, 2006
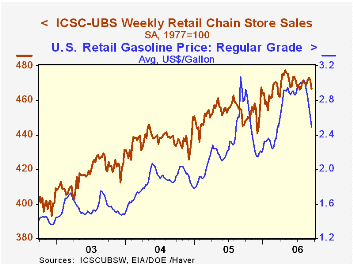
The ICSC-UBS retail chain-store sales index is constructed using the same-store sales (stores open for one year) reported by 78 stores of seven retailers: Dayton Hudson, Federated, Kmart, May, J.C. Penney, Sears and Wal-Mart.
The leading indicator of chain store sales from ICSC-UBS increased 0.8% (1.0% y/y) in the latest week and raised the y/y gain into positive territory for the first time since April. Household Energy Expenditures, 1982-2005 from the Federal Reserve Bank of Chicago is available hereThe latest Short-Term Energy Outlook from the U.S. Energy Information Administration is available here.
| ICSC-UBS (SA, 1977=100) | 09/16/06 | 09/09/06 | Y/Y | 2005 | 2004 | 2003 |
|---|---|---|---|---|---|---|
| Total Weekly Chain Store Sales | 466.8 | 471.8 | 4.9% | 3.6% | 4.7% | 2.9% |
by Louise Curley September 19, 2006
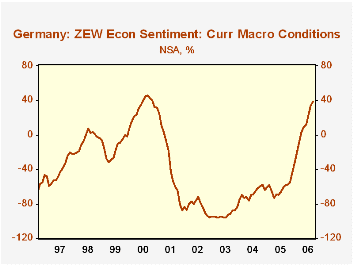
More German investors and analysts participating in the ZEW surveys continue to attest to improved economic conditions, but have grave doubts concerning economic conditions six months ahead.
The balance between those saying current conditions were improving and those saying current conditions were deteriorating rose from 33.6% in August to 38.9% in September and was 92.0 percentage points above the -58.1% of September, 2005. It has only been since April of this year that more people believed that current conditions were improving than those who believed they were deteriorating. The current balance is close to the most recent peak of 45.8% in September, 2000 as can be seen n the first chart.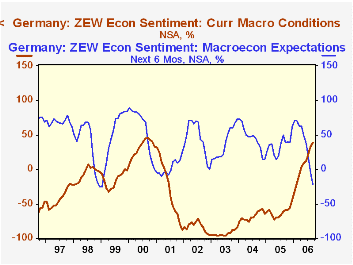
While feeling better about the current situation, the participants in the September ZEW survey have become decidedly more wary about the future. The balance between optimists and pessimists went from -5.6% in August to -22.2% in September and was 60.8 percentage points lower than that of September, 2005 when the balance favored the optimists to the extent of 38.6%. The sharp decline in sentiment is probably a reflection of the increasing probability of a slowdown in the United States economy and hence a reduced demand for German exports, plus the likely negative effect on consumer spending with the three point scheduled increase on January 1, 2007 of the VAT, and the uncertainty of other reforms. The contrast between opinions of current conditions and the future are shown in the second chart.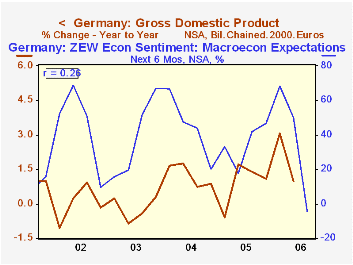
While the ZEW measure of expectations has often been an indicator of the future trend of the economy, it has not been a particularly good indicator of the magnitude of change in the economy. In the third chart we show the quarterly values of the expectations balances and the year to year change in real, seasonally unadjusted Gross National Product. As can be seen, there is only a small correlation (0.26) between the expectations balances and the year to year change in GDP. Moreover, the R2 suggests that only 6.76% of the change in the year to year GDP is accounted for by the expectations balance.
| Germany ZEW Survey | Sep 06 | Aug 06 | Sep 05 | M/M dif | Y/Y dif | 2005 | 2004 | 2003 |
|---|---|---|---|---|---|---|---|---|
| Balance on Current Situation (%) | 38.9 | 33.6 | -58.1 | 5.3 | 92.0 | -34.8 | 44.6 | 38.4 |
| Balance on Situation Six Months Ahead (%) | -22.2 | -5.6 | 38.6 | -16.6 | -60.8 | 34.8 | 44.6 | 38.4 |

Tom Moeller
AuthorMore in Author Profile »Prior to joining Haver Analytics in 2000, Mr. Moeller worked as the Economist at Chancellor Capital Management from 1985 to 1999. There, he developed comprehensive economic forecasts and interpreted economic data for equity and fixed income portfolio managers. Also at Chancellor, Mr. Moeller worked as an equity analyst and was responsible for researching and rating companies in the economically sensitive automobile and housing industries for investment in Chancellor’s equity portfolio. Prior to joining Chancellor, Mr. Moeller was an Economist at Citibank from 1979 to 1984. He also analyzed pricing behavior in the metals industry for the Council on Wage and Price Stability in Washington, D.C. In 1999, Mr. Moeller received the award for most accurate forecast from the Forecasters' Club of New York. From 1990 to 1992 he was President of the New York Association for Business Economists. Mr. Moeller earned an M.B.A. in Finance from Fordham University, where he graduated in 1987. He holds a Bachelor of Arts in Economics from George Washington University.
More Economy in Brief


