 Global| Aug 02 2007
PPI Trends Flatten Out and Decline Across EMU
Summary
Headline rise in June is +0.1% after +0.3% in May. Core trends pointing right directions but still at strong pace. While the ECB may be happy with the direction for inflation, the pace is nonetheless too high and the rate of reduction [...]
Headline rise in June is +0.1% after +0.3% in May.
Core trends pointing right directions but still at strong pace.
While the ECB may be happy with the direction for inflation, the pace is nonetheless too high and the rate of reduction is still slow (except in Italy where this partial ‘core measure’ of inflation is falling from a much higher pace).
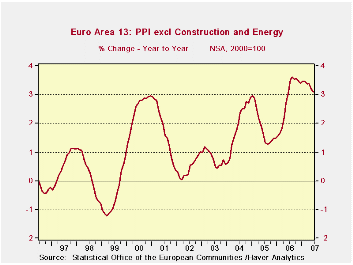
For all of EMU, PPI excluding energy and construction peaked at 3.6% in August of 2006 and has edged lower to 3.1% in June of 2007. That’s a reduction of 0.5% in the annual rate over a period of 10 months. That means it will take this quasi-core measure ( Q-core) about 22 months to get back to the CEILING rate of acceptability at 2%. That is a long wait for an inflation rate that already has been over the 2% limit for 36 months already. It would make one-half of a decade that the ECB ‘allowed’ Q-core inflation to run at a pace above its expressed ceiling.
The various key countries in the second graph do not have characteristics much different from this.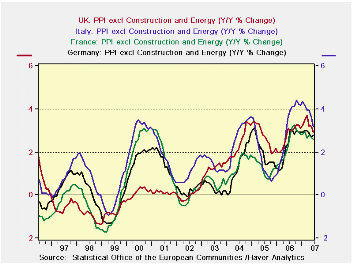
The table below gives us a sense of some of the details of the EMU PPI and some country level trends for overall and excluding energy PPI inflation. We express in RED those inflation rates where the pace is lower than in the previous period provided in the table. For example, nearly all categories and countries show inflation lower over the recent 12 months than in the previous 12 months. But only the UK shows inflation lower in the recent six month compared to the previous 12 months as well. And while some countries show lower inflation in the past three months than in the past six months, the general speed up for inflation in the six month pace compared to a year-ago does not make the current step down look like it is part of a fundamental trend. And that is a problem.
For the EMU PPI categories, only capital goods prices are below the 2% mark over three months although capital goods almost makes the grade for six months and the index is well below 2% for the past and previous 12 months. But this category stands alone in those respects. Capital goods prices have remained well behaved and have only one small and technical violation of the 2% ceiling. Of course I don’t mean to imply that the ECB ‘targets’ inflation below 2% for each price category; the rate ceiling applies to only headline inflation. But it is instructive to look at member countries as well as various categories to see where the outliers are.
Among countries only the Non EMU member EU-member UK has sequentially lower inflation rates with inflation falling steadily across all horizons in the table. UK ex-energy inflation trend does not do so well but it is on a better track than any EMU member.
On balance, neither overall nor country level trends in the PPI can encourage the ECB on inflation. And theses figure are for the PPI; services sector inflation, a key ingredient in national CPI (HICP) inflation rates is generally a bit more stubborn.
| M/M | SAAR | |||||
| EA 13 | Jun-07 | May-07 | 3-Mo | 6-MO | Yr/Yr | Y/Y Yr Ago |
| Total ex Construction | 0.1% | 0.3% | 3.8% | 3.8% | 2.3% | 5.8% |
| Excl Energy | 0.1% | 0.3% | 3.6% | 3.8% | 3.1% | 3.0% |
| Capital Goods | 0.0% | 0.1% | 0.7% | 2.1% | 1.9% | 1.3% |
| Consumer Goods | 0.2% | 0.2% | 2.7% | 2.6% | 1.6% | 1.8% |
| Intermediate &Capital Goods | 0.1% | 0.3% | 3.8% | 4.5% | 3.9% | 3.7% |
| Energy | 0.1% | 0.6% | 4.9% | 3.8% | -0.5% | 15.9% |
| MFG | 0.2% | 0.4% | 6.0% | 5.1% | 2.6% | 3.9% |
| Germany | 0.2% | 0.3% | 2.4% | 2.2% | 1.7% | 6.1% |
| Ex Energy | 0.2% | 0.2% | 3.3% | 2.9% | 2.8% | 2.4% |
| France | 0.2% | 0.2% | 3.6% | 3.4% | 1.9% | 3.9% |
| Ex Energy | 0.1% | 0.2% | 3.0% | 3.0% | 2.6% | 2.3% |
| Itlay | 0.2% | 0.4% | 4.4% | 3.9% | 2.8% | 6.2% |
| Ex Energy | 0.1% | 0.3% | 3.5% | 4.1% | 3.2% | 3.7% |
| UK | -0.2% | 0.2% | -7.6% | -7.1% | 0.6% | 9.8% |
| Ex Energy | 0.1% | 0.2% | 1.4% | 3.6% | 2.9% | 3.1% |
| EA 13 Harmonized PPI excluding Construction | ||||||
| The EA 13 countries are Austria, Belgium, Finland, France, Germany, Greece, Ireland, Italy, Luxembourg, the Netherlands, Portugal, Slovenia. | ||||||
| 6COLSPAN | ||||||

Robert Brusca
AuthorMore in Author Profile »Robert A. Brusca is Chief Economist of Fact and Opinion Economics, a consulting firm he founded in Manhattan. He has been an economist on Wall Street for over 25 years. He has visited central banking and large institutional clients in over 30 countries in his career as an economist. Mr. Brusca was a Divisional Research Chief at the Federal Reserve Bank of NY (Chief of the International Financial markets Division), a Fed Watcher at Irving Trust and Chief Economist at Nikko Securities International. He is widely quoted and appears in various media. Mr. Brusca holds an MA and Ph.D. in economics from Michigan State University and a BA in Economics from the University of Michigan. His research pursues his strong interests in non aligned policy economics as well as international economics. FAO Economics’ research targets investors to assist them in making better investment decisions in stocks, bonds and in a variety of international assets. The company does not manage money and has no conflicts in giving economic advice.
More Economy in Brief


