 Global| Oct 17 2006
PPI Fell, Core Prices Firm
by:Tom Moeller
|in:Economy in Brief
Summary
The overall producer price index dropped 1.3% last month and by far exceeded Consensus expectations for a 0.3% decline. Lower energy prices pulled down the total but excluding food & energy prices rose 0.6%, an increase that fully [...]
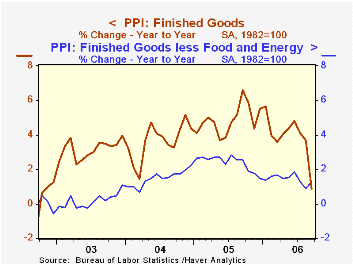
The overall producer price index dropped 1.3% last month and by far exceeded Consensus expectations for a 0.3% decline. Lower energy prices pulled down the total but excluding food & energy prices rose 0.6%, an increase that fully reversed the declines during the prior two months. Expectations had been for a 0.2% increase in the core PPI.
Finished energy goods prices dropped 8.4% (-1.6% y/y), led lower by a 22.2% m/m plunge in gasoline prices (-13.3% y/y) and an 18.5% (-0.1% y/y) decline in fuel oil prices. Residential electric power prices also fell 0.1% (+7.1% y/y) but natural gas prices increased 1.8% (-1.2% y/y).
Finished consumer goods prices less food & energy reversed the prior month's decline and rose 0.5% (1.1% y/y). The gain very much reflected a 2.8% (-3.6% y/y) increase in passenger car prices that reversed an August drop. Household furniture prices fell 0.1% (+3.4% y/y).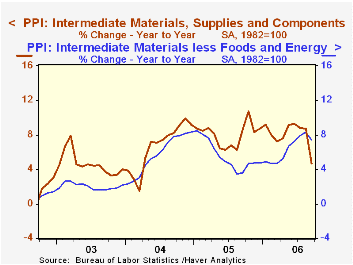
Capital equipment prices also were firm and rose 0.6% (1.5% y/y) for the first gain in three months. Light truck prices reversed the August drop and rose 3.5% (-4.8% y/y) while prices of pumps, compressors & equipment were strong again, rising 1.2% (4.3% y/y).
Intermediate goods prices dropped 1.4%, the first m/m decline since February, and prices less food & energy were similarly tame. The 0.1% increase was the smallest since August of last year.
The crude materials PPI dropped 3.4% due to a 13.3% (NSA, +0.8% y/y) drop in crude petroleum and a 5.5% skid in natural gas (NSA, -35.0% y/y). Less food & energy crude goods prices were, however, quite strong and rose 1.0% due to higher iron & steel scrap prices (4.4% y/y), higher prices for aluminum base scrap (29.2% y/y) and copper scrap prices which are up 70.9% y/y.
Why Are Yield Curves So Flat and Long Rates So Low Globally?, remarks by Federal Reserve Board Governor Randall S. Kroszner are available here.
| Producer Price Index | September | August | Y/Y | 2005 | 2004 | 2003 |
|---|---|---|---|---|---|---|
| Finished Goods | -1.3% | 0.1% | 0.9% | 4.9% | 3.6% | 3.2% |
| Core | 0.6% | -0.4% | 1.3% | 2.4% | 1.5% | 0.2% |
| Intermediate Goods | -1.4% | 0.4% | 4.7% | 8.0% | 6.6% | 4.7% |
| Core | 0.1% | 0.4% | 7.4% | 5.5% | 5.7% | 2.0% |
| Crude Goods | -3.4% | 2.2% | -7.8% | 14.6% | 17.5% | 25.1% |
| Core | 1.0% | -2.8% | 19.7% | 4.8% | 26.5% | 12.4% |
by Tom Moeller October 17, 2006
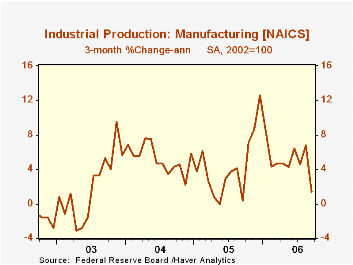
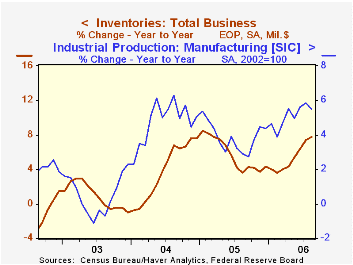
Total U.S. industrial output fell 0.6% last month. Though the decline followed an upwardly revised no change in August output, it again disappointed Consensus expectations which had been for just a 0.1% dip.
Factory sector output fell 0.3% and reversed all of the prior month's gain which was upwardly revised from no change. During the third quarter, factory output rose at a 4.2% annual rate versus 2Q which rose 5.1%.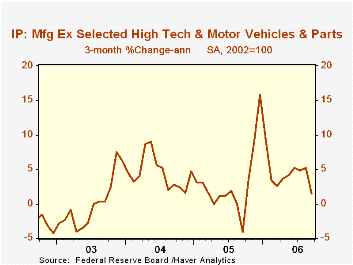
Production of durable consumer goods dropped 1.8% due to a 2.6% decline 9-7.7% y/y) in the output of automotive products. Output of appliances & furniture also was weak and fell 2.4% (-5.0% y/y). Nondurable consumer goods output fell 0.6% (+2.2% y/y) but nonenergy nondurables output rose 0.1% (3.1% y/y), the increase solely due to higher output of foods & tobacco (3.5% y/y).
Business equipment production slipped 0.2% after the upwardly revised 0.2% August gain. Output of information processing & equipment jumped 0.8% (16.7% y/y).Factory output overall less the hi-tech industries fell 0.5% (+4.8% y/y).
Overall capacity utilization fell to 81.9%, the lowest level since May.
| Production & Capacity | September | August | Y/Y | 2005 | 2004 | 2003 |
|---|---|---|---|---|---|---|
| Industrial Production | -0.6% | 0.0% | 5.5% | 3.2% | 4.1% | 0.6% |
| Manufacturing (NAICS) | -0.3% | 0.3% | 6.2% | 3.9% | 4.8% | 0.5% |
| Consumer Goods | -0.9% | 0.4% | 0.5% | 2.1% | 2.1% | 1.0% |
| Business Equipment | -0.2% | 0.2% | 18.5% | 9.1% | 9.3% | 0.0% |
| Capacity Utilization | 81.9% | 82.5% | 79.1% (9/05) | 80.1% | 78.6% | 75.7% |
by Tom Moeller October 17, 2006
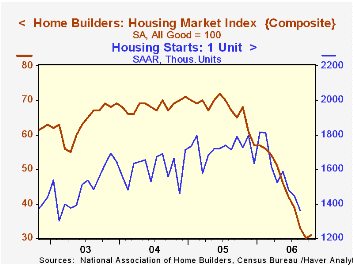
The National Association of Home Builders' (NAHB) October Composite Housing Market Index rose to 31 from 30 in September. It was the first m/m increase since last year. Regardless, the latest level remained down by more than one half from the levels of 2005.
During the last twenty years there has been a 75% correlation between the y/y change in the Composite Index and the change in single family housing starts.
The improvement was led a sharp gain in the sub-index covering prospective sales in the next six months (10.8% m/m, -43.8% y/y). The sub-index for current sales was unchanged m/m (-56.8% y/y).
Traffic of prospective home buyers rose modestly from the extremely low levels of the prior two months.
Only the housing market indexes for the Northeast (-50.7% y/y) and the Midwest (-55.6% y/y) improved m/m. In the South the index fell (-51.3%) as it did out West (-64.8% y/y).
The NAHB index is a diffusion index based on a survey of builders. Readings above 50 signal that more builders view conditions good than poor.
Visit the National Association of Home Builders.
| Nat'l Association of Home Builders | October | September | Oct. '05 | 2005 | 2004 | 2003 |
|---|---|---|---|---|---|---|
| Composite Housing Market Index | 31 | 30 | 68 | 67 | 68 | 64 |
by Tom Moeller October 17, 2006
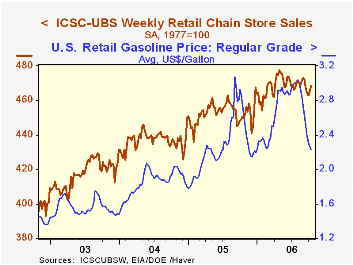
The ICSC-UBS retail chain-store sales index is constructed using the same-store sales (stores open for one year) reported by 78 stores of seven retailers: Dayton Hudson, Federated, Kmart, May, J.C. Penney, Sears and Wal-Mart.
The leading indicator of chain store sales from ICSC-UBS rose for the fifth week in the last six, by 0.1% (0.8% y/y).The latest Short-Term Energy Outlook from the U.S. Energy Information Administration is available here.
| ICSC-UBS (SA, 1977=100) | 10/14/06 | 10/07/06 | Y/Y | 2005 | 2004 | 2003 |
|---|---|---|---|---|---|---|
| Total Weekly Chain Store Sales | 468.1 | 465.4 | 3.9% | 3.6% | 4.7% | 2.9% |
by Louise Curley October 17, 2006
The ZEW measure of economic sentiment among analysts and institutional investors regarding the economic outlook six months ahead fell from -22.2%in September to -27.4% in October, that is, the pessimists outweighed the optimists by 27.4%. This is the lowest value since March 1993. In October of last year, the optimists outweighed the pessimists by 39.4%.
At the same time, among the participants in the survey, those who appraised the current situation positively outweighed those who appraised it negatively by 42.9%, the highest value since October 2000. The October value was up from 38.9% in September and from -58.0% in October of 2005. The first chart compares the views of the ZEW participants on the current situation and the outlook six months ahead.
The rapid and sustained rise in the appraisal of current conditions reflects the surprising strength of the German economy in the current year. The Economic Minister, Michael Glos, recently said that the ministry will raise its estimate of 2006 growth to 2.5% from 1.6% estimated last April. It is not surprising, therefore, that investors view the future with some caution. This is especially true given the inevitability of tax increases on January 1, 2007 that are likely to dampen consumer spending. The VAT (value added tax) is scheduled to rise from 16% to 19% and social security contributions will also increase.
The other major indicator of sentiment in Germany is the IFO measure to be released October 25th. The ZEW measure is based on a small sample--some 300 participants--and represents the opinions of the financial community. The IFO measure is based on a much broader sample--some 7000 participants--and represents the opinions of businessmen engaged in manufacturing, construction, wholesale and retail trade. In the appraisal of the current situation, the two surveys reveal similar views, although the views of the financial community tend to be more volatile than those of the industrialists and trades people. The second chart compares the appraisal of the current situation by the two institutes. The correlation between the two series is fairly high .83.
In the appraisal of the outlook, there is less agreement in the views of the two sectors, represented by a lower correlation--.67--and again, the views of the financial community tend to be more volatile than those of the industrialists and trades people.The third chart compares the views on the outlook of both groups.
| GERMANY ZEW (Balance of Opinion) | Oct 06 | Sep 06 | Oct 05 | M/M Dif | Y/Y Dif | 2005 | 2004 | 2003 |
|---|---|---|---|---|---|---|---|---|
| Current Situation | 42.9 | 38.9 | -58.0 | 4.0 | 100.9 | -61.8 | -67.7 | -92.6 |
| Outlook Six Months Ahead | -27.4 | -22.2 | 39.4 | -5.2 | -66.8 | 34.8 | 44.6 | 38.4 |

Tom Moeller
AuthorMore in Author Profile »Prior to joining Haver Analytics in 2000, Mr. Moeller worked as the Economist at Chancellor Capital Management from 1985 to 1999. There, he developed comprehensive economic forecasts and interpreted economic data for equity and fixed income portfolio managers. Also at Chancellor, Mr. Moeller worked as an equity analyst and was responsible for researching and rating companies in the economically sensitive automobile and housing industries for investment in Chancellor’s equity portfolio. Prior to joining Chancellor, Mr. Moeller was an Economist at Citibank from 1979 to 1984. He also analyzed pricing behavior in the metals industry for the Council on Wage and Price Stability in Washington, D.C. In 1999, Mr. Moeller received the award for most accurate forecast from the Forecasters' Club of New York. From 1990 to 1992 he was President of the New York Association for Business Economists. Mr. Moeller earned an M.B.A. in Finance from Fordham University, where he graduated in 1987. He holds a Bachelor of Arts in Economics from George Washington University.
More Economy in Brief


