 Global| Apr 23 2021
PMIs Show Ongoing Growth
Summary
The flash PMIs from Markit show EMU values with the composite PMI rising to 53.7 in April from 53.2 in March. The manufacturing gauge actually ticked higher while the service sector PMI rose, carrying the day and pushing the composite [...]
 The flash PMIs from Markit show EMU values with the composite PMI rising to 53.7 in April from 53.2 in March. The manufacturing gauge actually ticked higher while the service sector PMI rose, carrying the day and pushing the composite index higher. The services gauge moved back above the 50 mark to 50.3 from 49.6, registering the first service sector growth in EMU since August 2020.
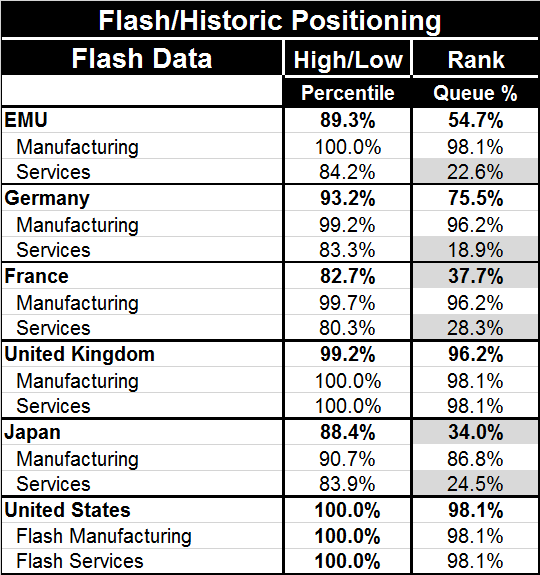
This small rise, to a position just above the expansion point for EMU services (a raw diffusion value of 50), nonetheless, brings the services reading to the 84th percentile of its 4.5-year high-low range but still only elevates it to a queue standing at its 22nd percentile- essentially in the range between the bottom 20% and bottom 25% of all values in that 4.5-year period.
These two positioning metrics (high/low and ranking) tell us that the service sector in the EMU has not had very strong values in the last 4-plus years since a reading of 50.3, that barely registers expansion, resides in the top 16th percentile of its historic high-low range. This weakness is underscored by the the current reading's rank that is still among the 20% to 25% weakest over the same period. Obviously this last 4.5 years has been a tough period for the EMU.
Remember how these high-low (percentile) and rank (or queue) metrics fit together when looking at the rest of the table. The two evaluation systems may put very different values on the current positional readings, but they are not inconsistent; they are just positioning the readings based on differing criteria. Together these two positioning systems help us to better understand what the current raw diffusion PMI readings mean.
The EMU service sector is simply a rather extreme version of the differences that can be produced. However, the EMU percentile and queue positioning evaluations for manufacturing are not much different from each other. In fact, they give the same signals since the high/low standing that brands the manufacturing reading as the highest of the period; the queue standing says the month's value is this high or higher only about two percent of the time, which is what one observation gets you on this timeline (53 observations).
Both Germany and France share the same properties as the EMU overall with moderately high service sector high-low positioning versus low service sector queue standings. Both also have extremely strong manufacturing observations; in each case, manufacturing has backed down slightly in April.
The U.K. shows exceptional positioning for both sectors on both positioning techniques. The raw U.K. PMI values for manufacturing are competitive with the raw readings from Germany and France but a step or so behind them while the U.K. service sector raw diffusion reading is head and shoulders stronger than similar readings for Germany, France or the EMU (note that no raw diffusion data are shown in the table). The U.K. economy is beginning to shed the skin of virus restriction and that is beginning to show itself in the raw PMI readings, and of course, in the metrics that evaluate those readings.
Japan follows the paradigm set in the EMU. Japan's composite index still is strong with an 88th percentile standing on the high/low scale. And the relevant queue standing for the composite is weak at a 34th percentile queue standing; this is below the mark for the EMU, much weaker than Germany and slightly weaker than France. Japan's manufacturing sector has a 90.7 percentile high-low standing and an 86.8 percentile queue standing. Services in Japan are following the lead of the EMU as well, with a relatively high percentile (high/low) standing matched against a bottom quartile queue standing.
The U.S. joins the U.K. with superlative positional standings all around for all PMI metrics whether positioned in either system. But the U.S. composite backed down this month on a sizeable set back. The oddity of the percentile standings finds this month's value rated as the highest ever on the timeline when in fact it has stepped down from 63.8 in March. How is that possible? This owes to the fact that the rankings and high/low standings are generated across all flash data and last month's flash was lower than this month's flash, but it was revised higher for the U.S. In this way, we choose to compare apples to apples (that is, flash to flash) in the rankings.
Summary findings
The main lesson from this month's PMI readings is that manufacturing remains strong although it may have come slightly off the boil. Service sectors generally improved but not by much and the U.S. is an exception to that trend (Japan is unchanged). All raw diffusion readings show all sectors expanding except for services in Japan. Despite some consistently high percentile positioning based on high-low standings, the queue metrics remind us that the service sector is still greatly impacted- although the U.S. and the U.K. are 'exceptional exceptions' with extremely high readings- more on that below.
 Caveat emptor (reader)
We must take the PMI readings and standings with a grain or two of salt. PMIs evaluate the breadth of industry performance over a 4.5-year period in this framework. Only about 14 months of that period was affected by the virus (about 26% of it). And all these countries and the EMU region in the table have elevated rates of unemployment and all of them still have big holes in their respective service sectors. There is something peculiar about the U.S. and the U.K. returning such high standing values for their service sectors in face of actual service sectors with large portions of the businesses operating on vapors or still shuttered 100%. How, in such circumstances, can these be the best readings in 4.5 years' time, when for about 75% of that period such restrictions were not in place-and national rates of unemployment were even lower? This is my caution about using PMI data to evaluate economic performance. These data are not compiled like the 'accounting' data of old. We are not taking a sample, counting up output in the sector and evaluating the strength of output or sales by blowing up the sample to mimic the whole industry. We are looking at reports from firms responding about business conditions giving a response that is essentially binary –either better or worse...with an allowance for 'the same.' From that we form indexes for the sector or industry. These reading may be economically 'sensitive' but they are still only 'blunt instruments.' One question about interpreting these data at a time such as this is how these surveys treat nonresponsive respondents. I have discussed this issue here before. Quite simply if a firm goes out of business and is excluded from the tally of the survey, the survey may actually get stronger. That is counter intuitive. So it is a good idea to be somewhat skeptical of the message being carried to us by PMI data. The message probably gives a good general trend but beware trying to put too a fine point on that message.

Robert Brusca
AuthorMore in Author Profile »Robert A. Brusca is Chief Economist of Fact and Opinion Economics, a consulting firm he founded in Manhattan. He has been an economist on Wall Street for over 25 years. He has visited central banking and large institutional clients in over 30 countries in his career as an economist. Mr. Brusca was a Divisional Research Chief at the Federal Reserve Bank of NY (Chief of the International Financial markets Division), a Fed Watcher at Irving Trust and Chief Economist at Nikko Securities International. He is widely quoted and appears in various media. Mr. Brusca holds an MA and Ph.D. in economics from Michigan State University and a BA in Economics from the University of Michigan. His research pursues his strong interests in non aligned policy economics as well as international economics. FAO Economics’ research targets investors to assist them in making better investment decisions in stocks, bonds and in a variety of international assets. The company does not manage money and has no conflicts in giving economic advice.
More Economy in Brief


