 Global| May 17 2007
Philly Index Points Way Higher
Summary
Pictured on the left is the Philadelphia barometer for its OUTLOOK index that looks 6-months ahead. The index has made a considerable rebound and is now closer to giving off a signal of normal growth for the future based on the [...]
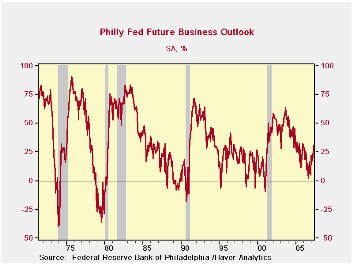
Pictured on the left is the Philadelphia barometer for its OUTLOOK index that looks 6-months ahead. The index has made a considerable rebound and is now closer to giving off a signal of normal growth for the future based on the position of this index in its range of values going back to 1968.
Few plot this index but I like it because it has been such a good and consistent harbinger of recessions and weakness and then of recovery (see chart). The index turned negative and before each recession since 1974. If you view a below zero reading as a signal for recession, it has given off some false ones, but it does give off weak signals when MFG is weak and its reports tend to be early-to-timely. Its ‘false’ signals have tended to be more isolated or single weak readings. However, ahead of the 2001 recession this index did not give off a powerful series of negative readings it just gave off a few. But then it did emit strong signals of coming recovery – and that was even though the recovery itself proved to be tepid. .
The signal for this index that is unimpeachable is that once it has been weak and rebounds it signals growth The only thing close to an exception to this result was that the cluster of recession-indicating weaker readings ahead of the 1991 recession was followed by a series of positive readings (none as strong as +20, however) before the recession actually occurred. The index had signaled recession ahead. But then there was a weak rise (weaker than what the barometer is signaling right now) and then recession kicked in. Once the recession started the outlook barometer dipped again, then moved up strongly near the end of recession to signal oncoming recovery.
Against that background the recovery signals from the Philly outlook are now impressively stronger and are coming off a set of weak readings that did not turn the barometer negative at any point. It may not be safe to assume anything but this index is something to encourage you to become more optimistic. It is signaling continued growth.
Its upbeat signal joins with the sharp March rise in industrial output and the recovery in the Empire State index for May. Jobless claims fell further below the 300k level this week in another upbeat sign. Economic signals remain mixed to be sure but a series of reports from this week (and I’ll throw in the tentative sign of bottoming from housing starts) are reason to be more optimistic.
The table below grinds out relationships for the more conventionally watched Philadelphia current index. The various readings confirm that the current index is still quite weak but it has moved up with the key orders and shipments series as two of the best-advancing components. Employment has advanced sharply even if it has been at the cost of the length of the work week. Substituting full time workers for longer hours is usually a good sign for the economy.
| Index:C | New Ord:C | Shipmnt:C | Deliv. | Inventory | Backlog | Pr:Pd | Pr:Rcd | Employ:C | Wrk Hrs | |
| May-07 | 4.2 | 8.7 | 9.3 | -8.2 | -6.9 | -9.1 | 32.3 | 2.2 | 12.9 | -5.5 |
| Apr-07 | 0.2 | 2.8 | 4.3 | -11.9 | -3.1 | -13.7 | 24.3 | 5.2 | 2.5 | 5.5 |
| Mar-07 | 0.2 | 1.9 | 6.8 | -13.2 | -3.7 | -20.9 | 21.8 | 16.3 | 2.3 | -4.9 |
| Average | 9.7 | 10.6 | 14.7 | -3.4 | -6.8 | -5.8 | 29.8 | 11.3 | -0.1 | -1.1 |
| Median | 11.5 | 13.3 | 15.9 | -2.5 | -6.8 | -4.3 | 26.7 | 8.9 | 2.1 | 0.0 |
| max | 58.9 | 56.2 | 48.3 | 19.9 | 27.6 | 44.6 | 91.0 | 63.8 | 24.4 | 22.7 |
| Min | -57.9 | -53.5 | -32.2 | -33.6 | -50.7 | -60.9 | -16.4 | -18.2 | -40.0 | -45.6 |
| % of Range reading | ||||||||||
| Current | 53.2% | 56.7% | 51.6% | 47.5% | 55.9% | 49.1% | 45.3% | 24.9% | 82.1% | 58.7% |
| Future | 43.4% | 56.7% | 56.7% | 51.7% | 39.2% | 41.5% | 36.4% | 34.7% | 54.5% | 52.7% |
by Robert Brusca May 17, 2007
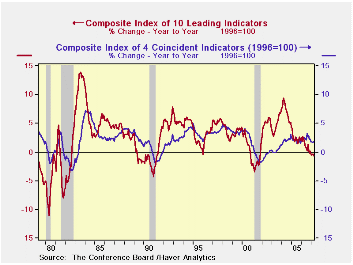
The LEI is increasing its year/year pace of decline and is now falling by 0.7% year/year. However, a brief look at history shows that the current combination of a weak LEI and weak coincident index is not producing a weakening at a pace that signals recession. They are weakening more like they did in 1995, but not even as severely as that…and there is less weakening power in the pipeline that it seems.
Periods in which the coincident index is growing more slowing than the leading index do tend to be slowdown periods. But not all of them become recession periods. Some of them are extended periods that eventually transition into recession. Only the aftermath of the 1995 episode left a good solid period of growth in its wake.
While the LEI has dropped to a weaker growth rate on year/year measures, this is not a period with increased downward momentum in general. The 3-month and 6-month rates of growth are not getting progressively lower. The six month rate speeded up but the three-month rate is the one that has fallen sharply. Over the same recent three-months the coincident index has speeded up slightly. The LEI has been very flat so that there is really little in the way for further declines in the pipeline from one-year ago. May of 2006 was weaker than April of that year implying that the year/year LEI will be lower by only 0.2% year/year unless it falls further in May. Even the three-month growth rate (annualized) is not set for further weakness despite its relatively sharp drop in April. If the LEI is unchanged next month it will rise in May over the next three-month period, not fall.
Apart from these technical considerations there are the economic data that have begun to show a bit more strength.
The LEI is falling. Its rate of decline has accelerated this month. But there does not appear to be an ongoing process here nor does the rate of descent appear to be particularly disturbing.
| LEADING | COINCIDENT | LAGGING | |
| Month-to-month | |||
| Apr-07 | -0.5% | 0.2% | 0.2% |
| Mar-07 | 0.6% | 0.1% | 0.0% |
| Feb-07 | -0.6% | 0.2% | 0.2% |
| Jan-07 | -0.3% | -0.1% | -0.1% |
| SAAR | |||
| 3-Mos | -2.0% | 1.6% | 1.6% |
| 6-Mos | -0.4% | 1.3% | 3.7% |
| 12-Mos | -0.7% | 1.7% | 3.3% |
by Carol Stone May 17, 2007
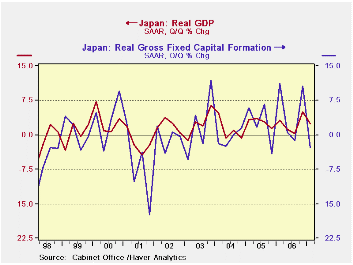
Japanese GDP grew at a 2.4% annual rate in Q1, less than Q4's 5.0% and less than market expectations of 2.7%. Q4 was also revised downward from 5.5% reported in mid-March.
The slower growth was due to a contraction in investment, and Q4's investment amount was also reduced from prior reports. So total fixed capital formation fell at a 2.8% rate, following growth of 10.6% in Q4. Residential was off 1.3% in Q1 and nonresidential plant and equipment at a 3.7% rate. The revision to Q4 was small for residential but nonresidential was cut from 13.2% to 9.4% growth. Even so, plant & equipment expenditures for 2006 as a whole came in at 11.0%. Thus, the decrease in Q1 came on the heels of quite strong gains during last year. Further, new depreciation rules went into effect with the new fiscal year in April, and the accounting change would have discouraged major capital spending just before that.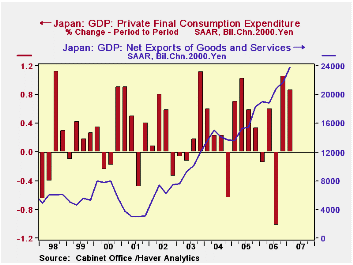
By contrast, consumption did well. In Q1, it grew at a 3.5% annual rate, following 4.3% in Q4. These two quarters are a considerable pick-up from last year's overall tepid performance. And Q4 was even revised a bit higher. Net exports also added to overall growth, as exports themselves grew 13.9%, annualized, in Q1 after 3.4% in Q4. This latter figure was also revised upward for Q4, which previously had shown 2.4% growth. Partially offsetting, imports switched from their declining pattern in Q3 (-1.5%) and Q4 2006 (-0.5%) to a moderate gain of 3.8% in Q1. The amount in Q4 was revised upward marginally.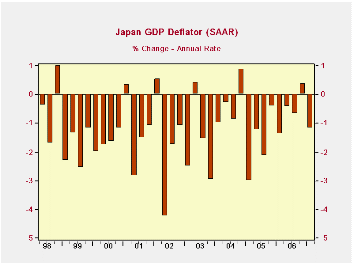
The transitory accounting-rule factors on capital spending can well mean that it will turn back up soon. And the nice back-to-back growth in consumer spending is encouraging. Prices do persist in their decline. We calculated a deflator from the seasonally adjusted GDP figures, and it fell 1.2% in Q1, although it had risen 0.4% in Q4. The "official" deflator based on not seasonally adjusted data was off just 0.2% year-on-year in Q1. Government officials assert that Japan is on the verge of breaking out of deflation, and these recent patterns suggest that is an apt description. In this space on Monday, Louise Curley noted the role of its vibrant Asian neighbors in boosting the Japanese economy. So there look to be a number of positive forces in the outlook.
| JAPAN (% Chg, SAAR*) | Q1 2007 | Q4 2006 | Q3 2006 | Year/ Year | 2006 | 2005 | 2004 |
|---|---|---|---|---|---|---|---|
| Real GDP | 2.4 | 5.0 | 0.3 | 2.0 | 2.4 | 2.8 | 1.1 |
| Private Consumption | 3.5 | 4.3 | -4.0 | 1.6 | 0.5 | 2.7 | 0.4 |
| Government Consumption | -0.3 | 0.3 | 2.5 | 1.2 | 1.3 | 0.8 | 1.3 |
| GFCF** | -2.8 | 10.6 | -1.2 | 1.7 | 5.3 | 2.5 | -0.7 |
| Private Residential | -1.3 | 8.9 | -1.0 | -0.2 | 1.0 | -0.5 | 2.6 |
| Plant & Equipment | -3.7 | 9.4 | 3.8 | 4.7 | 11.0 | 4.2 | 2.5 |
| Public Investment | -0.6 | 17.0 | -17.6 | -6.8 | -8.0 | 0.5 | -5.4 |
| Exports | 13.9 | 3.4 | 9.6 | 7.4 | 6.3 | 10.4 | 10.5 |
| Imports | 3.8 | -0.5 | -1.5 | 2.0 | 2.8 | 4.4 | 9.5 |

Robert Brusca
AuthorMore in Author Profile »Robert A. Brusca is Chief Economist of Fact and Opinion Economics, a consulting firm he founded in Manhattan. He has been an economist on Wall Street for over 25 years. He has visited central banking and large institutional clients in over 30 countries in his career as an economist. Mr. Brusca was a Divisional Research Chief at the Federal Reserve Bank of NY (Chief of the International Financial markets Division), a Fed Watcher at Irving Trust and Chief Economist at Nikko Securities International. He is widely quoted and appears in various media. Mr. Brusca holds an MA and Ph.D. in economics from Michigan State University and a BA in Economics from the University of Michigan. His research pursues his strong interests in non aligned policy economics as well as international economics. FAO Economics’ research targets investors to assist them in making better investment decisions in stocks, bonds and in a variety of international assets. The company does not manage money and has no conflicts in giving economic advice.
More Economy in Brief


