 Global| May 20 2005
Philadelphia Fed Index Reversed Course
by:Tom Moeller
|in:Economy in Brief
Summary
The May Index of General Business Conditions in the manufacturing sector from the Philadelphia Fed reversed all of the prior month's improvement and fell 18.0 points to 7.3, its lowest level since June 2003. Consensus expectations had [...]
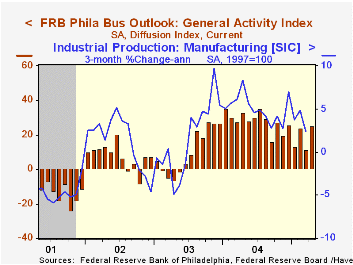
The May Index of General Business Conditions in the manufacturing sector from the Philadelphia Fed reversed all of the prior month's improvement and fell 18.0 points to 7.3, its lowest level since June 2003. Consensus expectations had been for a lesser decline to 17.3.
During the last ten years there has been a 68% correlation between the level of the Philadelphia Fed Business Conditions Index and three month growth in factory sector industrial production. There has been a 52% correlation with q/q growth in real GDP.
The shipments index reversed all of the prior month's sharp increase and about halved to the lowest level since 2003 while the number of employees index also fell sharply to the lowest since 2003. During the last ten years there has been a 64% correlation between the employment index and the three month growth in factory payrolls.
The business conditions index reflects a separate survey question, not the sub indexes.
The separate index of expected business conditions in six months improved moderately to the highest level this year.
The prices paid index slid sharply again and at 30.9 is less than half the peak level of January 2005. During the last ten years there has been a 75% correlation between the prices paid index and the three month growth in the intermediate goods PPI. The correlation with the finished goods PPI has been 50% and with the CPI it's been 43%.
The Philadelphia Fed index is based on a survey of 250 regional manufacturing firms, but these firms sell nationally and internationally.
The latest Business Outlook survey from the Philadelphia Federal Reserve Bank can be found here.
Modeling Inflation: A Policymaker's Perspective, today's speech by Federal Reserve Board Governor Donald L. Kohn is available here.
| Philadelphia Fed Business Outlook | May | April | May '04 | 2004 | 2003 | 2002 |
|---|---|---|---|---|---|---|
| General Activity Index | 7.3 | 25.3 | 27.9 | 28.1 | 10.6 | 7.7 |
| Prices Paid Index | 30.9 | 50.5 | 56.4 | 51.3 | 16.8 | 12.3 |
by Carol Stone May 20, 2005
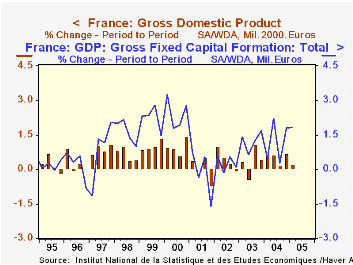
GDP growth in France slowed markedly in Q1 to 0.2% from 0.7% in Q4 2004. A smaller gain in household consumption and an outright decline in exports were responsible for the sluggish Q1 performance. Notably, however, fixed capital formation sustained its Q4 gain of 1.3%; of this, nonfinancial corporations' capital investment grew 1.6%, making for a 4.0% advance year-on-year.
By industry, value added in manufacturing fell 0.2%, with declines in intermediate goods and automobile production. Among service-producing industries, overall growth was 0.3%, following 0.7% in Q4. Performances of individual service sectors was quite mixed, with declines, for instance, in transportation and personal services, but further sizable increases in finance and real estate.
The volume measures in this GDP report for France are the first using 2000 as a base year, moving from 1995. The data are all revised historically. The price measures still have fixed weights, with 2000 prices. Chain-weighting of price indexes is set to be introduced in May 2006. In the table below, we show total GDP growth at 1995 prices; a quick comparison of these few observations suggests that the switch in base years had little impact on basic growth patterns, although it did alter individual periods.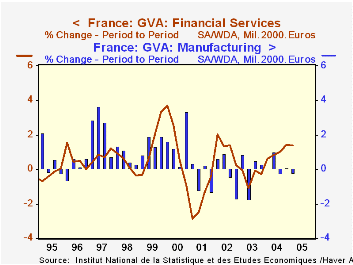
| France | Q1 2005 | Q4 2004 | Year/Year | 2004 | 2003 | 2002 |
|---|---|---|---|---|---|---|
| GDP - 2000 Prices | 0.2 | 0.7 | 1.7 | 2.1 | 0.9 | 1.3 |
| Memo: GDP - 1995 Prices | -- | 0.9 | -- | 2.4 | 0.5 | 1.1 |
| Household Consumption | 0.7 | 1.1 | 2.2 | 2.3 | 1.6 | 2.3 |
| Gross Fixed Capital Formation | 1.3 | 1.3 | 3.3 | 2.2 | 2.7 | -1.7 |
| Exports | -0.1 | 0.9 | 2.1 | 2.4 | -1.7 | 1.5 |
| Imports | 0.6 | 1.0 | 7.0 | 6.1 | 1.3 | 1.5 |

Tom Moeller
AuthorMore in Author Profile »Prior to joining Haver Analytics in 2000, Mr. Moeller worked as the Economist at Chancellor Capital Management from 1985 to 1999. There, he developed comprehensive economic forecasts and interpreted economic data for equity and fixed income portfolio managers. Also at Chancellor, Mr. Moeller worked as an equity analyst and was responsible for researching and rating companies in the economically sensitive automobile and housing industries for investment in Chancellor’s equity portfolio. Prior to joining Chancellor, Mr. Moeller was an Economist at Citibank from 1979 to 1984. He also analyzed pricing behavior in the metals industry for the Council on Wage and Price Stability in Washington, D.C. In 1999, Mr. Moeller received the award for most accurate forecast from the Forecasters' Club of New York. From 1990 to 1992 he was President of the New York Association for Business Economists. Mr. Moeller earned an M.B.A. in Finance from Fordham University, where he graduated in 1987. He holds a Bachelor of Arts in Economics from George Washington University.
More Economy in Brief


