 Global| Oct 19 2006
Philadelphia Fed Index Remained Negative
by:Tom Moeller
|in:Economy in Brief
Summary
The Philadelphia Federal Reserve Bank's Index of General Business Conditions in the manufacturing sector remained negative in October. The figure slipped to -0.7 from an unrevised -0.4 last month and disappointed Consensus [...]
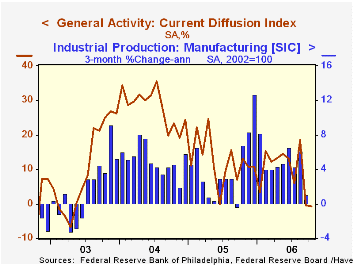
The Philadelphia Federal Reserve Bank's Index of General Business Conditions in the manufacturing sector remained negative in October. The figure slipped to -0.7 from an unrevised -0.4 last month and disappointed Consensus expectations for improvement to 6.5.
During the last ten years there has been a 65% correlation between the level of the Philadelphia Fed Business Conditions Index and three month growth in factory sector industrial production. There has been a 49% correlation with q/q growth in real GDP.
Sharp deterioration into negative territory by the indexes for unfilled orders, delivery times and the average workweek presumably pulled the overall index down.
The sub indexes for orders, shipments and inventories each recovered sharply back into positive territory. The employment index fell moderately m/m but remained in the positive range of the last year. During the last ten years there has been a 75% correlation between the employment index and the three month growth in factory payrolls.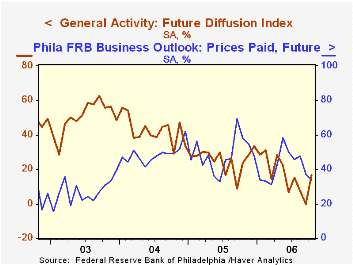
The business conditions index reflects a separate survey question, not the sub indexes.
The prices paid index fell m/m to the lowest level since April. During the last ten years there has been a 76% correlation between the prices paid index and the three month growth in the intermediate goods PPI. There has been an 85% correlation with the change in core intermediate goods prices.
The separate index of expected business conditions in six months improved sharply to the highest level since May.
The latest Business Outlook survey from the Philadelphia Federal Reserve Bank can be found here.
| Philadelphia Fed Business Outlook | October | September | Oct. '05 | 2005 | 2004 | 2003 |
|---|---|---|---|---|---|---|
| General Activity Index | -0.7 | -0.4 | 13.1 | 12.4 | 28.0 | 10.5 |
| Prices Paid Index | 32.0 | 38.1 | 66.7 | 43.5 | 51.2 | 16.8 |
by Tom Moeller October 19, 2006
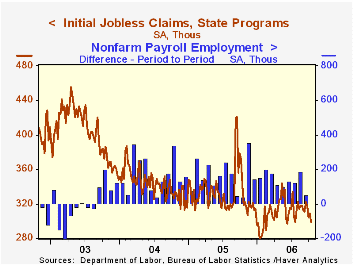
Last week, initial claims for jobless insurance fell 10,000 to 299,000 after a little revised increase the week earlier. It was the third decline in the last four weeks and dropped claims to the lowest level since early June. Consensus expectations had been for 310,000 claims.
The latest figure covers the survey period for October nonfarm payrolls and and claims were down 23,000 (-7.1%) from the September period.
During the last ten years there has been a (negative) 78% correlation between the level of initial claims and the m/m change in nonfarm payroll employment.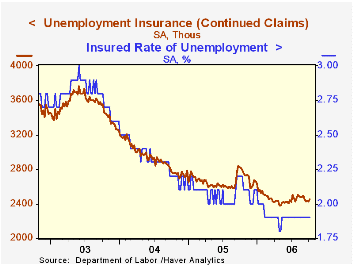
The four-week moving average of initial claims fell to 307,750 (-15.1% y/y).
Continuing claims for unemployment insurance rose 25,000 after a revised 12,000 decline the prior week that initially was reported as a 5,000 w/w increase.
The insured rate of unemployment was steady at 1.9% where it has been since February.
Health Insurance Costs and Declining Coverage from the Federal Reserve Bank of San Francisco can be found here.
| Unemployment Insurance (000s) | 10/14/06 | 10/07/06 | Y/Y | 2005 | 2004 | 2003 |
|---|---|---|---|---|---|---|
| Initial Claims | 299 | 308 | -12.8% | 332 | 343 | 403 |
| Continuing Claims | -- | 2,453 | -13.0% | 2,662 | 2,924 | 3,532 |
by Tom Moeller October 19, 2006
The Conference Board reported that the composite index of leading economic indicators ticked 0.1% higher last month following an unrevised 0.2% August decline. It was the first m/m rise since June but fell short of Consensus expectations for a 0.3% gain.
During the last ten years there has been a 59% correlation between the y/y change in the leading indicators and the lagged change in real GDP.
The breadth of one month gain amongst the 10 components of the leading index improved to 50%, the highest level since June.
The method of calculating the contribution to the leading index from the spread between 10 year Treasury securities and the Fed funds rate has been revised. A negative contribution will now occur only when the spread inverts rather than when declining as in the past. More details can be found here.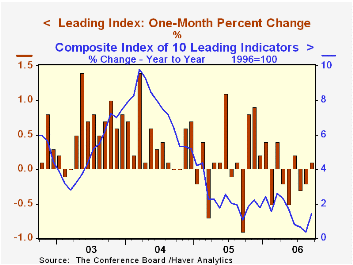
The leading index is based on eight previously reported economic data series. Two series, orders for consumer goods and orders for capital goods, are estimated.
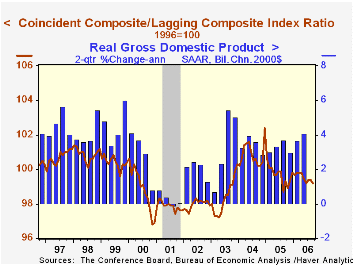
The coincident indicators were unchanged following an upwardly revised 0.2% increase during August. Over the last ten years there has been a 91% correlation between the y/y change in the coincident indicators and real GDP growth.
The lagging indicators increased 0.2% for the second month as the CPI for services posted its largest positive contribution since late last year. The ratio of coincident to lagging indicators, which is a measure of actual economic performance versus excess, fell.
Visit the Conference Board's site for coverage of leading indicator series from around the world.
Inflation Persistence in an Era of Well-Anchored Inflation Expectations from the Federal Reserve Bank of San Francisco is available here.
| Business Cycle Indicators | September | August | Y/Y | 2005 | 2004 | 2003 |
|---|---|---|---|---|---|---|
| Leading | 0.1% | -0.2% | 1.4% | 2.3% | 7.4% | 5.0% |
| Coincident | 0.0% | 0.2% | 2.7% | 2.2% | 2.5% | 0.4% |
| Lagging | 0.2% | 0.2% | 2.8% | 3.5% | 0.0% | -0.0% |

Tom Moeller
AuthorMore in Author Profile »Prior to joining Haver Analytics in 2000, Mr. Moeller worked as the Economist at Chancellor Capital Management from 1985 to 1999. There, he developed comprehensive economic forecasts and interpreted economic data for equity and fixed income portfolio managers. Also at Chancellor, Mr. Moeller worked as an equity analyst and was responsible for researching and rating companies in the economically sensitive automobile and housing industries for investment in Chancellor’s equity portfolio. Prior to joining Chancellor, Mr. Moeller was an Economist at Citibank from 1979 to 1984. He also analyzed pricing behavior in the metals industry for the Council on Wage and Price Stability in Washington, D.C. In 1999, Mr. Moeller received the award for most accurate forecast from the Forecasters' Club of New York. From 1990 to 1992 he was President of the New York Association for Business Economists. Mr. Moeller earned an M.B.A. in Finance from Fordham University, where he graduated in 1987. He holds a Bachelor of Arts in Economics from George Washington University.
More Economy in Brief


