 Global| Jul 21 2016
Philadelphia Fed Business Conditions Survey Provides Mixed Readings
by:Tom Moeller
|in:Economy in Brief
Summary
The Philadelphia Federal Reserve reported that its General Factory Sector Business Conditions Index declined in July to -2.9 from an unrevised 4.7 in June. Despite the lower reading, it remained up from December's low of -10.2. The [...]
The Philadelphia Federal Reserve reported that its General Factory Sector Business Conditions Index declined in July to -2.9 from an unrevised 4.7 in June. Despite the lower reading, it remained up from December's low of -10.2. The increase compared to expectations for 4.7 in the Action Economics Forecast Survey.
Moving the other way, the ISM-Adjusted General Business Conditions Index, constructed by Haver Analytics increased to 49.9 from 46.0, though both readings continued to indicate declining activity. The ISM-Adjusted headline index is the average of five diffusion indexes: new orders, shipments, employment, supplier deliveries and inventories with equal weights (20% each). This figure is comparable to the ISM Composite Index. During the last ten years, there has been a 71% correlation between the adjusted Philadelphia Fed Index and real GDP growth.
The decline in the Philadelphia Fed index was similar to the lower Empire State reading, released Friday. A lower prices paid index provided downward pressure on the overall index, as it fell to the lowest level since March. A lessened seventeen percent of respondents paid higher prices, while a higher seven percent paid less. The prices received measure also retreated to the lowest level since February.
Amongst the other components, the new orders and shipments indexes improved. Employment remained negative, although the rate of decline eased. During the last ten years, there has been an 81% correlation between the jobs index and the m/m change in manufacturing payrolls.
The future business activity index improved moderately. Unfilled orders, inventories, employment and prices paid rose.
The survey panel consists of 150 manufacturing companies in Federal Reserve District III (consisting of southeastern PA, southern NJ and Delaware). The diffusion indexes represent the percentage of respondents indicating an increase minus the percentage indicating a decrease in activity. The ISM adjusted figure, calculated by Haver Analytics, is the average of five diffusion indexes: new orders, production, employment, supplier deliveries and inventories with equal weights (20% each). Each diffusion index is the sum of the percent responding "higher" and one-half of the percent responding "same."
The figures from the Philadelphia Federal Reserve can be found in Haver's SURVEYS database. The Action Economics figure is available in AS1REPNA.
| Philadelphia Fed - Manufacturing Business Outlook Survey (%, SA) | Jul | Jun | May | Jul'15 | 2015 | 2014 | 2013 |
|---|---|---|---|---|---|---|---|
| General Factory Sector Business Conditions | -2.9 | 4.7 | -1.8 | 0.7 | 3.6 | 18.3 | 6.1 |
| ISM-Adjusted Business Conditions | 49.9 | 46.0 | 47.6 | 48.5 | 49.4 | 53.7 | 50.0 |
| New Orders | 11.8 | -3.0 | -1.9 | 3.1 | 2.9 | 14.9 | 7.2 |
| Shipments | 6.3 | -2.1 | -0.5 | -0.8 | 3.0 | 16.1 | 6.8 |
| Unfilled Orders | 1.9 | -12.6 | -8.8 | -8.7 | -5.1 | 3.3 | -3.9 |
| Delivery Time | 1.3 | -8.3 | -14.6 | -5.4 | -6.4 | 0.6 | -4.1 |
| Inventories | -4.3 | -9.9 | -2.5 | -4.0 | -1.5 | 1.7 | -3.5 |
| Number of Employees | -1.6 | -10.9 | -3.3 | -2.6 | 3.9 | 10.5 | 1.4 |
| Prices Paid | 9.9 | 23.0 | 15.7 | 14.8 | 1.5 | 21.6 | 16.4 |
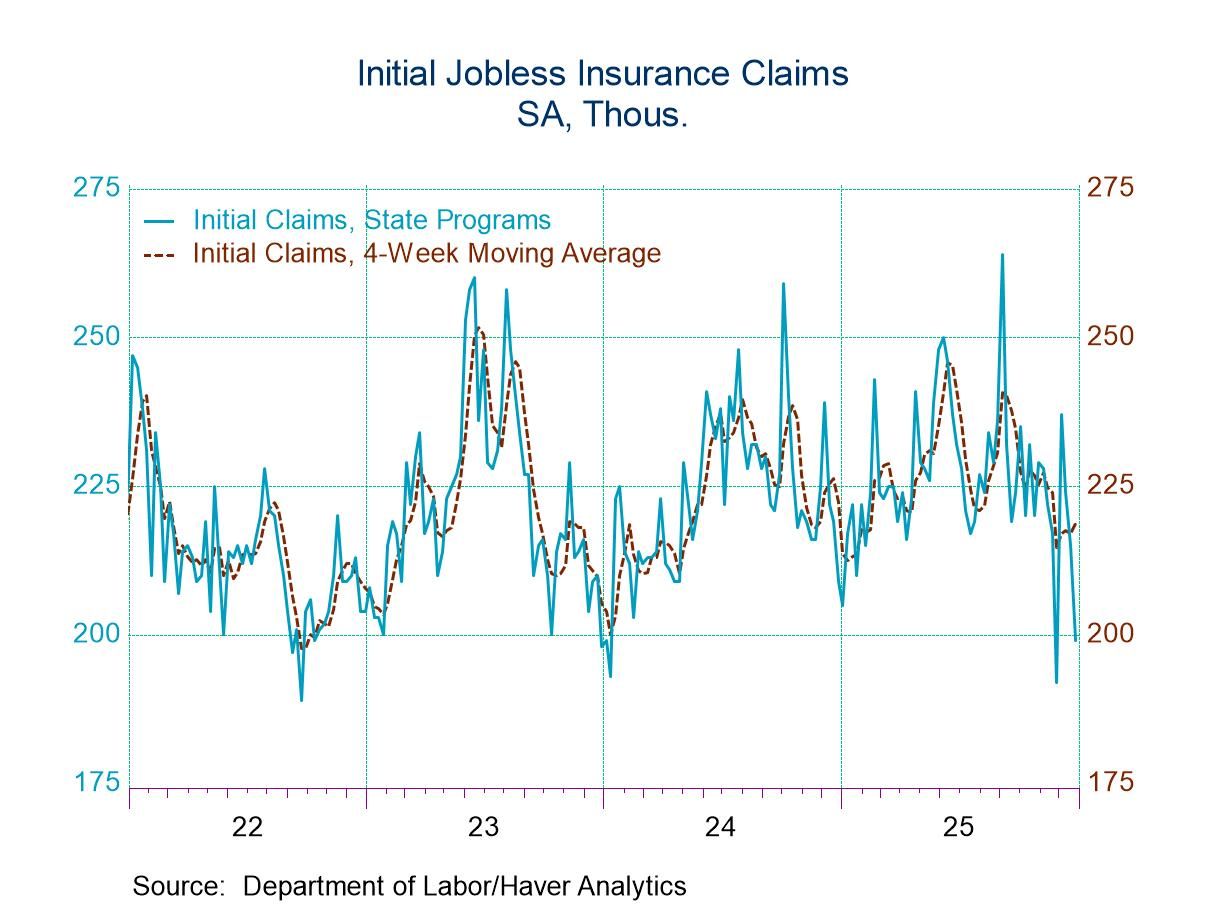
U.S. Initial Unemployment Insurance Claims Dip Initial claims for unemployment insurance of 253,000 (-3.8% y/y) during the
week ended July 16 compared to an unrevised 254,000 in the prior week. They
remained near a record low. The Action Economics Forecast Survey expected 262,000
claims. The four-week moving average of claims ease to 257,750. The latest claims figure covers the survey week for July nonfarm payrolls.
Claims fell 5,000 (-1.9%) from the June period. During the last ten years, there
has been a 74% correlation between the level of claims and the m/m change in
payroll employment. In the week ending July 9, continuing claims for unemployment insurance fell
to 2.128 million (-4.5% y/y) from 2.153 million. Continuing claims were near the
lowest level since 2000. The four-week moving average eased to 2.141 million. The insured rate of unemployment returned to the record low of 1.5%. Insured rates of unemployment continued to vary across states. Near the low
end of the range were South Dakota (0.36%), Nebraska (0.55%) Florida (0.66%),
Indiana (0.75%), Virginia (0.81%) and Tennessee (0.89%). At the high end of the
scale were Texas (1.60%), Nevada (1.84%), Massachusetts (1.95%), Illinois (1.92%),
Pennsylvania (2.45%) and New Jersey (2.62%). The state data are not seasonally
adjusted. Data on weekly unemployment insurance are contained in Haver's WEEKLY
database and they are summarized monthly in USECON. Data for individual
states are in REGIONW. The expectations figure is from the Action
Economics survey, carried in the AS1REPNA database. 1.7
by Tom Moeller July
21, 2016
Unemployment Insurance (000s)
07/16/16
07/09/16
07/02/16
Y/Y
2015
2014
2013
Initial Claims
253
254
254
-3.8%
277
307
342
Continuing Claims
--
2,128
2,153
-4.5
2,268
2,607
2,978
Insured Unemployment Rate (%)
--
1.5
1.6
(July 2015)1.7
2.0
2.3
U.S. Existing Home Sales Reach Highest Level Since 2007
by Tom Moeller July 21, 2016
Sales of existing homes increased 1.8% (4.5% y/y) during May to 5.530 million (SAAR) from 5.430 million in April, revised from 5.450 million. The latest level was the highest since February 2007. It surpassed expectations for 5.55 million sales in the Action Economics Forecast Survey. Sales of existing single-family homes gained 1.9% last month (4.7% y/y) to 4.900 million. Sales of condos & cops rose 1.6% (3.3% y/y) to 630,000.
The median price of all previously owned homes increased 3.8% to $239,700 (4.7% y/y) from $230,900, revised from $232,500. Annualized growth in prices has been roughly steady for the past two years, but falls short of the double-digit increases in 2013. The average price of an existing home increased 3.0% to $281,700 (3.2% y/y).
Home sales were strongest last month in the West where they posted a 5.4% rise (-1.7% y/y) to 1.180 million. Home sales in the South followed with a 4.6% rise (6.5% y/y) to 2.280 million. Home sales in the Northeast increased 4.1% (11.6% y/y) to 770,000, but they declined 6.5% (+3.2% y/y) to 1.300 million in the Midwest.
The number of existing homes on the market declined 5.7% y/y, but the months' supply of homes held at 4.7, about where it's been for three years.
The data on existing home sales, prices and affordability can be found in Haver's USECON database. The regional price, affordability and inventory data are available in the REALTOR database. The expectations figure is from the Action Economics Forecast Survey, reported in the AS1REPNA database.
| Existing Home Sales (SAAR, 000s) | Jun | May | Apr | Y/Y % | 2015 | 2014 | 2013 |
|---|---|---|---|---|---|---|---|
| Total | 5,530 | 5,430 | 4.5 | 5,254 | 4,935 | 5,087 | |
| Northeast | 770 | 740 | 11.6 | 691 | 645 | 658 | |
| Midwest | 1,300 | 1,390 | 3.2 | 1,240 | 1,136 | 1,201 | |
| South | 2,280 | 2,180 | 6.5 | 2,151 | 2,051 | 2,040 | |
| West | 1,180 | 1,120 | -1.7 | 1,172 | 1,103 | 1,188 | |
| Single-Family | 4,900 | 4,810 | 4.7 | 4,626 | 4,344 | 4,484 | |
| Median Price Total ($, NSA) | 239,700 | 230,900 | 4.7 | 219,867 | 206,708 | 195,667 |
U.S. Leading Economic Indicators Rebound
by Tom Moeller July 21, 2016
The Conference Board's Composite Index of Leading Economic Indicators increased 0.3% during June (0.7% y/y), following an unrevised 0.2% May decline. Expectations had been for a 0.2% rise in the Action Economics Forecast Survey. The three-month change in the index improved to 2.3% (AR) versus its peak growth of 7.1% roughly one year ago. Lower initial claims for unemployment insurance had the largest positive impact on the total index followed by a steeper interest rate yield curve. The leading credit index increased and most other component posted modest increases. A shorter average workweek provided the only negative influence on the total.
The coincident index remained unchanged (1.7% y/y) following a 0.2% rise, revised from 0.3%. Three-month growth deteriorated to 0.7% (AR). Industrial production had a negative effect on the total, while nonfarm payrolls, personal income less transfers and manufacturing & trade sales contributed positively to the index.
The lagging index increased 0.3% (4.2% y/y) after a downwardly revised 0.2% gain. Three month growth eased to a still strong 4.7%. A longer duration of unemployment, a higher consumer installment debt/personal income ratio and more C&I loans had the largest positive impacts on the index. Growth in labor costs contributed negatively.
The ratio of coincident-to-lagging indicators also is a leading indicator of economic activity. It measures excesses in the economy relative to its ongoing performance. This ratio continued a decline to the lowest level since 1961.
The Conference Board figures are available in Haver's BCI database; the components are available there, and most are also in USECON. The expectations are in the AS1REPNA database. Visit the Conference Board's site for coverage of leading indicator series from around the world.
| Business Cycle Indicators (%) | Jun | May | Apr | Jun Y/Y | 2015 | 2014 | 2013 |
|---|---|---|---|---|---|---|---|
| Leading | 0.3 | -0.2 | 0.5 | 0.7 | 4.3 | 5.8 | 2.9 |
| Coincident | 0.3 | 0.0 | 0.2 | 1.8 | 2.5 | 2.6 | 1.4 |
| Lagging | -0.1 | 0.4 | 0.2 | 3.4 | 3.7 | 3.7 | 3.9 |
Chicago Fed National Activity Index Deteriorates
by Tom Moeller July 21, 2016
The National Activity Index from the Federal Reserve Bank of Chicago declined to -0.51 during May, following one month in positive territory. It suggested below-trend overall economic growth. The three month moving average reinforced this notion by being in negative territory since February 2015. During the last ten years, there has been a 77% correlation between the Chicago Fed Index and the q/q change in real GDP.
Each of the component series declined last month. The Production & Income reading fell sharply to -0.32, its lowest point in six months. The Personal Consumption & Housing figure declined to -0.09. The Employment, Unemployment & Hours figure also fell to -0.09, the weakest reading in nine months. The Sales, Orders & Inventories figure was fairly steady at -0.01. The Fed reported that 28 of the 85 component series made positive contributions to the total while 57 made negative contributions.
The CFNAI is a weighted average of 85 indicators of national economic activity. It is constructed to have an average value of zero and a standard deviation of one. Since economic activity tends toward trend growth rate over time, a positive index reading corresponds to growth above trend and a negative index reading corresponds to growth below trend.
The Chicago Federal Reserve figures are available in Haver's SURVEYS database.
| Chicago Federal Reserve Bank | Jun | May | Apr | Jun '15 | 2015 | 2014 | 2013 |
|---|---|---|---|---|---|---|---|
| National Activity Index (percent) | -0.51 | 0.05 | -0.33 | -0.17 | 0.16 | -0.08 | |
| 3-Month Moving Average | -0.36 | -0.25 | -0.11 | -- | -- | -- | |
| Personal Consumption & Housing | -0.09 | -0.02 | -0.05 | -0.09 | -0.11 | -0.15 | |
| Employment, Unemployment & Hours | -0.09 | -0.06 | 0.03 | 0.07 | 0.18 | 0.09 | |
| Production & Income | -0.32 | 0.13 | -0.10 | -0.14 | 0.06 | -0.04 | |
| Sales, Orders & Inventories | -0.01 | 0.00 | -0.20 | -0.02 | 0.04 | 0.02 |
h
Tom Moeller
AuthorMore in Author Profile »Prior to joining Haver Analytics in 2000, Mr. Moeller worked as the Economist at Chancellor Capital Management from 1985 to 1999. There, he developed comprehensive economic forecasts and interpreted economic data for equity and fixed income portfolio managers. Also at Chancellor, Mr. Moeller worked as an equity analyst and was responsible for researching and rating companies in the economically sensitive automobile and housing industries for investment in Chancellor’s equity portfolio. Prior to joining Chancellor, Mr. Moeller was an Economist at Citibank from 1979 to 1984. He also analyzed pricing behavior in the metals industry for the Council on Wage and Price Stability in Washington, D.C. In 1999, Mr. Moeller received the award for most accurate forecast from the Forecasters' Club of New York. From 1990 to 1992 he was President of the New York Association for Business Economists. Mr. Moeller earned an M.B.A. in Finance from Fordham University, where he graduated in 1987. He holds a Bachelor of Arts in Economics from George Washington University.


