 Global| Nov 30 2020
Pending Home Sales Fell Again in October
by:Sandy Batten
|in:Economy in Brief
Summary
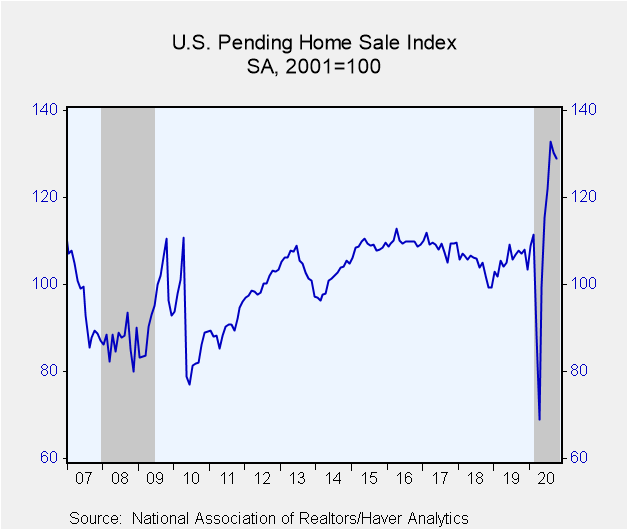
• Second monthly decline in pending home sales after four consecutive monthly increases. • Sales drop concentrated in Northeast. Pending home sales fell 1.1% m/m (+20.2% y/y) in October, their second consecutive monthly decline [...]
• Second monthly decline in pending home sales after four consecutive monthly increases.
• Sales drop concentrated in Northeast.
Pending home sales fell 1.1% m/m (+20.2% y/y) in October, their second consecutive monthly decline following four monthly increases according to data released by the National Association of Realtors (NAR). The 2.2% m/m drop in September was revised up to a 2.0% decline. The index level slipped to 128.9 (2001=100) in October, still remains well above its COVID-lockdown induced trough of 69.0 in April. Shrinking supply and low interest rates are putting upward pressure on prices which is beginning to restrain some potential buyers, especially first-time buyers.
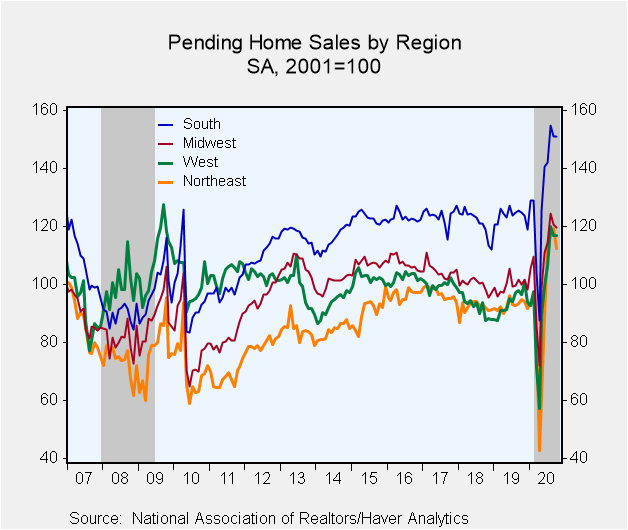
The October decline was concentrated in the Northeast where pending sales fell 5.9% m/m (+18.5% y/y) after having increased in each of the previous five months. Sales in the Midwest edged down 0.7% m/m (+19.6% y/y) in October on top of a 3.2% m/m drop in September. Sales in the South were essentially unchanged, rising 0.1% m/m (+21.0% y/y) while sales in the West were actually unchanged (+20.8% y/y).
The pending home sales index measures sales at the time the contract for the purchase of an existing home is signed, analogous to the Census Bureau's new home sales data. In contrast, the National Association of Realtors' existing home sales data are recorded when the sale is closed. In developing the pending home sales index, the NAR found that the level of monthly sales contract activity leads the level of closed existing home sales by about two months. The series dates back to 2001, and the data are available in Haver's PREALTOR database. Mortgage interest rates from the Mortgage Bankers Association can be found in the SURVEYW database.
| Pending Home Sales (SA, % chg) | Oct | Sep | Aug | Oct Y/Y % | 2019 | 2018 | 2017 |
|---|---|---|---|---|---|---|---|
| Total | -1.1 | -2.0 | 8.8 | 20.2 | 1.1 | -4.1 | -0.8 |
| Northeast | -5.9 | 2.0 | 4.3 | 18.5 | 0.8 | -5.0 | 0.6 |
| Midwest | -0.7 | -3.2 | 8.6 | 19.6 | -0.3 | -4.6 | -2.5 |
| South | 0.1 | -2.4 | 8.9 | 21.0 | 1.8 | -1.9 | 0.6 |
| West | 0.0 | -2.6 | 12.7 | 20.8 | 1.3 | -7.3 | -2.5 |
Sandy Batten
AuthorMore in Author Profile »Sandy Batten has more than 30 years of experience analyzing industrial economies and financial markets and a wide range of experience across the financial services sector, government, and academia. Before joining Haver Analytics, Sandy was a Vice President and Senior Economist at Citibank; Senior Credit Market Analyst at CDC Investment Management, Managing Director at Bear Stearns, and Executive Director at JPMorgan. In 2008, Sandy was named the most accurate US forecaster by the National Association for Business Economics. He is a member of the New York Forecasters Club, NABE, and the American Economic Association. Prior to his time in the financial services sector, Sandy was a Research Officer at the Federal Reserve Bank of St. Louis, Senior Staff Economist on the President’s Council of Economic Advisors, Deputy Assistant Secretary for Economic Policy at the US Treasury, and Economist at the International Monetary Fund. Sandy has taught economics at St. Louis University, Denison University, and Muskingun College. He has published numerous peer-reviewed articles in a wide range of academic publications. He has a B.A. in economics from the University of Richmond and a M.A. and Ph.D. in economics from The Ohio State University.


