 Global| Jun 29 2007
PCE Report is Weaker Than Expected With Good Inflation
Summary
Personal income +0.4% in May. Real PCE spending is up by just 01% in May as services spending falls by 0.1%. Core PCE +0.1% and +1.9% Yr/Yr. Consumption has a moderate contribution to growth in Q2 advancing by just 1.6% in the quarter [...]
Personal income +0.4% in May.
Real PCE spending is up by just 01% in May as services spending falls by 0.1%.
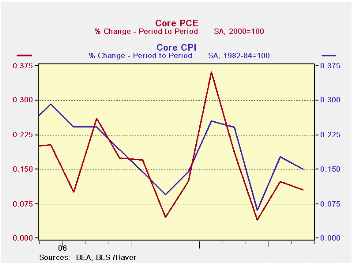
Core PCE +0.1% and +1.9% Yr/Yr.
Consumption has a moderate contribution to growth in Q2 advancing by just 1.6% in the quarter after its weak performance in May (see far right-hand column in table). The 0.5% gain in the overall PCE hit spending hard, reducing it.
Real disposable personal income is falling in Q2 down by 1.5%.
Core inflation continues lower… much like with CPI.
Inflation took a large bite out of nominal spending trends this month. Previously Q2 spending was on a much stronger track. On top of that, current dollar spending was weaker than expected, posting at a gain of 0.5%. That was made worse when translated into real terms by the 0.5% hike in the overall PCE deflator. As a result real spending was left with a gain of just 0.1% reducing its growth in Q2 to just 1.6%. (SAAR). The jump in the deflator also cut real disposable personal income down and it is now falling in the quarter as well as falling by 0.1% in the month. The saving rate continues negative and shows no sign of rising.
Perhaps the most surprising development in the report is the drop in services spending. While it spurted in April it had also fallen sharply in May. Services spending has now dropped in two of the past three months and is growing at just an annual rate of 0.7% over those three months. This is very weak for a sector that supplies the bulk of our employment. This weakness is the most troubling thing in this report.
The core deflator is, however, well behaved and the Fed will be happy with its trend. At 2.9% it is now inside the Fed’s comfort zone and the CPI is well inside of its zone as well.
| Percentage Changes At Annualized Rates: Various Horizons | |||||
| Inflation-adjusted | 1-Mo:AR | 3-Mos | 6-Mos | One Year | Q2/Q1 |
| Consumption | 0.8% | 0.9% | 2.8% | 3.1% | 1.6% |
| Goods | 3.7% | 1.3% | 3.0% | 3.7% | 0.3% |
| Durable Goods | 7.0% | 3.5% | 5.3% | 5.9% | 1.5% |
| Nondurable Goods | 2.0% | 0.2% | 1.8% | 2.6% | -0.4% |
| Services | -1.0% | 0.7% | 2.9% | 2.8% | 2.6% |
| Consumer Income | -- | -- | -- | -- | -- |
| Real DPI | -1.1% | -1.5% | 1.5% | 3.4% | -1.5% |
| Per Capita | -2.0% | -2.4% | 0.7% | 2.4% | |
| Memo: | May.07 | 3-Mos | 6-Mos | One-Year | -- |
| Savings Rate (Pct) | -1.4 | -1.0 | -1.0 | -1.1 | -- |
| 113% | 113% | 100% | 116% | 111% | 108% | 104% | 111% |
|---|

Robert Brusca
AuthorMore in Author Profile »Robert A. Brusca is Chief Economist of Fact and Opinion Economics, a consulting firm he founded in Manhattan. He has been an economist on Wall Street for over 25 years. He has visited central banking and large institutional clients in over 30 countries in his career as an economist. Mr. Brusca was a Divisional Research Chief at the Federal Reserve Bank of NY (Chief of the International Financial markets Division), a Fed Watcher at Irving Trust and Chief Economist at Nikko Securities International. He is widely quoted and appears in various media. Mr. Brusca holds an MA and Ph.D. in economics from Michigan State University and a BA in Economics from the University of Michigan. His research pursues his strong interests in non aligned policy economics as well as international economics. FAO Economics’ research targets investors to assist them in making better investment decisions in stocks, bonds and in a variety of international assets. The company does not manage money and has no conflicts in giving economic advice.
More Economy in Brief


