 Global| Apr 12 2010
OECD LEIs Show StrongestSynchronized Revival Since 1975 Expansion
Summary
History tells us that gains this strong do not continue to accelerate like this for very long. Already the sequential growth rates are showing that the pace of growth is beginning to ebb even though the 12-month rates continue to [...]
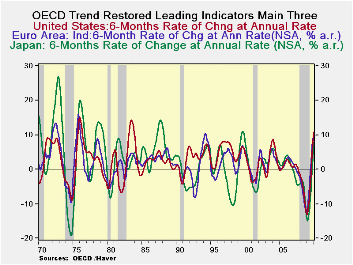
History tells us that gains this strong do not continue to accelerate like this for very long. Already the sequential growth rates are showing that the pace of growth is beginning to ebb even though the 12-month rates continue to accelerate. Despite that, the six- month growth rates, the horizon on which the OECD prefers to evaluate its indices, shows a slow down from the previous 6 months but still posts strong rates of expansion. The whole of the OECD area is still advancing at a rate of 8.6% over six months, the e-Zone is up at a 6.6% pace and the US is up at a 10.5% pace. Japan alone is still accelerating, to a pace of 8.6% over six months.
But economic recovery is not simply achieved by getting out of the woods with a strong LEI reading. As we have seen, Europe is dogged by debt problems from Greece to Portugal to Spain. The UK, in the midst of elections, has posted some very erratic economic figures including a recent spike in its PPI. Today Italy posted a sideways IP result with output remaining flat month-to-month. By itself that does not sound so bad, but Italy has a long way to go to restore output to its past cycle peak level. So a month of no progress is not a good result.
The OECD data tell us, however, that results are improving across the OECD area and that conditions in Japan are accelerating. For the time being it is still good news but it is still not good enough given all the post-cycle risks that continue to lurk and to chase after the outlook.
| OECD Trend-restored leading Indicators | ||||
|---|---|---|---|---|
| Growth progression-SAAR | ||||
| 3Mos | 6Mos | 12mos | Yr-Ago | |
| OECD | 6.5% | 8.6% | 10.1% | -11.7% |
| OECD7 | 6.7% | 8.9% | 10.2% | -12.9% |
| OECD.Ezone | 3.5% | 6.6% | 9.8% | -12.1% |
| OECD.Japan | 7.0% | 8.6% | 7.6% | -14.6% |
| OECD US | 9.1% | 10.5% | 10.9% | -13.1% |
| Six month readings at 6-Mo Intervals: | ||||
| Recent six | 6Mo Ago | 12Mo Ago | 18MO Ago | |
| OECD | 8.6% | 11.6% | -14.1% | -9.2% |
| OECD7 | 8.9% | 11.6% | -16.3% | -9.4% |
| OECD.Eur | 6.6% | 13.0% | -12.4% | -11.8% |
| OECD.Japan | 8.6% | 6.6% | -21.1% | -7.6% |
| OECD US | 10.5% | 11.2% | -17.6% | -8.3% |
| Slowdowns indicated by BOLD RED | ||||
by Louise Curley April 12, 2010
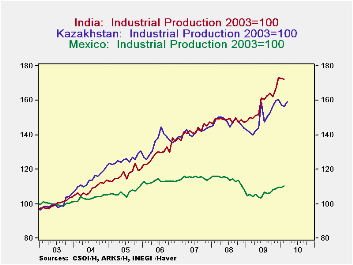 Five
countries--Italy, Ireland, India, Kazakhstan and Mexico--reported
February data on industrial production today. One, Kazakhstan
reported data for March. We have put the various
indexes on a common basis, 2003=100, so that growth of production can
be compared. Production in Italy in February, for example, at
84.8, was still well below its level of 100 in 2003. And
although production in Ireland has increased sharply in the last two
months, it is only 20% above its 2003 level after seven
years. Industrial production data in Italy and Ireland since
Five
countries--Italy, Ireland, India, Kazakhstan and Mexico--reported
February data on industrial production today. One, Kazakhstan
reported data for March. We have put the various
indexes on a common basis, 2003=100, so that growth of production can
be compared. Production in Italy in February, for example, at
84.8, was still well below its level of 100 in 2003. And
although production in Ireland has increased sharply in the last two
months, it is only 20% above its 2003 level after seven
years. Industrial production data in Italy and Ireland since
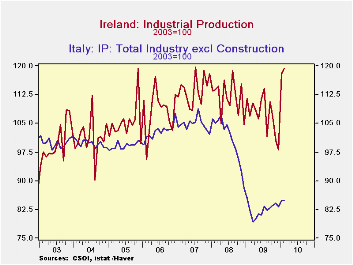 2003
are shown in the first chart.
2003
are shown in the first chart.
Industrial production in India and Kazakhstan declined 0.25% and 0.68% in February from January, but it has been increasing over the past year and is 15.0% and 10.4%, respectively, ahead of January, 2009. Incidentally, production in Kazakhstan rose in March. Both India and Kazakhstan have grown strongly in the past seven years and production is now 73% and 56%, respectively above their 2003 levels of production.
In contrast to the performance of industrial production in India and Kazakhstan, that in Mexico, the other emerging country reporting today, has recently shown some improvement but it has grown only 10% since 2003. Industrial production data since 2003 for the three emerging countries are shown in the second chart.
It should be noted that a common index base of production among countries enables one to compare the growth of production among countries, but it says nothing of the magnitude of output in the various countries.
| Industrail Production (2003=100) | ||||||||
|---|---|---|---|---|---|---|---|---|
| Feb 10 | Jan 10 | Feb 09 | M/M % Chg | Y/Y % Chg | 2009 | 2008 | 2007 | |
| India | 172.5 | 172.9 | 149.9 | -0.25 | 15.02 | 158.4 | 149.0 | 142.2 |
| Kazakhstan | 156.3* | 157.4 | 141.6 | -0.68 | 10.38 | 149.8 | 147.5 | 146.5 |
| Mexico | 110.3 | 109.5 | 105.6 | 0.55 | 4.45 | 106.1 | 114.0 | 115.0 |
| Italy | 84.8 | 84.8 | 83.5 | 0.00 | 2.95 | 82.4 | 100.8 | 104.8 |
| Ireland | 119.3 | 117.9 | 106.8 | 1.2 | 11.7 | 107.2 | 111.9 | 113.7 |
| *March-159.2 | ||||||||
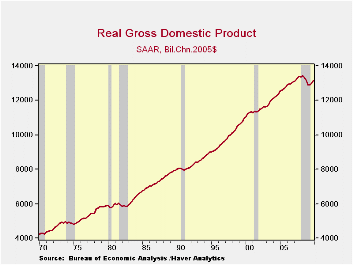
by Tom Moeller April 12, 2010
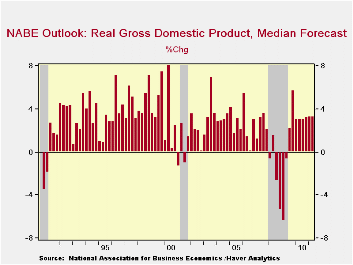
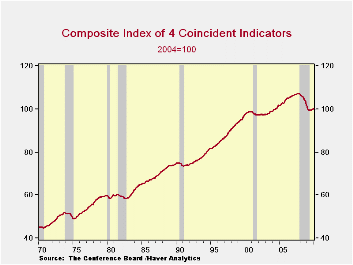
The Business Cycle Dating Committee at the National Bureau of Economic Research indicated that it's premature to call an end to the U.S. recession. Their latest communiqué can be found here.
Nevertheless, Haver Analytics has gone ahead and updated the business cycle shading in its charts, primarily for two reasons. We have chosen June 2009 as the end date for the recession: 1) The index of coincident economic indicators, which includes data covering nonfarm payrolls, industrial production, business sales and personal income, troughed in June. 2) Real GDP growth has been positive since 3Q '09 and likely was again positive last quarter. The 1Q data will be published later this month.

Robert Brusca
AuthorMore in Author Profile »Robert A. Brusca is Chief Economist of Fact and Opinion Economics, a consulting firm he founded in Manhattan. He has been an economist on Wall Street for over 25 years. He has visited central banking and large institutional clients in over 30 countries in his career as an economist. Mr. Brusca was a Divisional Research Chief at the Federal Reserve Bank of NY (Chief of the International Financial markets Division), a Fed Watcher at Irving Trust and Chief Economist at Nikko Securities International. He is widely quoted and appears in various media. Mr. Brusca holds an MA and Ph.D. in economics from Michigan State University and a BA in Economics from the University of Michigan. His research pursues his strong interests in non aligned policy economics as well as international economics. FAO Economics’ research targets investors to assist them in making better investment decisions in stocks, bonds and in a variety of international assets. The company does not manage money and has no conflicts in giving economic advice.
More Economy in Brief


