 Global| Sep 11 2006
OECD Leaders Slip A Third Month
by:Tom Moeller
|in:Economy in Brief
Summary
The Leading Index of the major 7 OECD economies fell 0.3% in July for the second consecutive month and it was the third monthly decline in a row. The index's six month growth rate dropped to 0.8%, the lowest in a year. During the last [...]
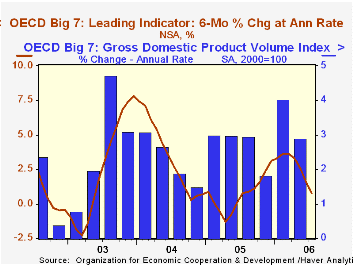
The Leading Index of the major 7 OECD economies fell 0.3% in July for the second consecutive month and it was the third monthly decline in a row. The index's six month growth rate dropped to 0.8%, the lowest in a year.
During the last ten years there has been a 64% correlation between the change in the leading index and the q/q change in the GDP Volume Index for the Big Seven OECD countries.
The leading index for the European Union (15 countries) fell 0.2% and the index's six month growth rate fell to 2.9%, the lowest since last November. During the last ten years there has been a 59% correlation between the change in the leading index and the quarterly change in the European Union GDP volume index.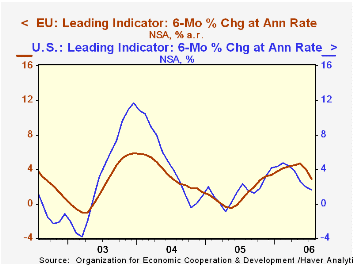
The German leading index fell 0.5% for the second consecutive monthly decline which lowered the six month growth rate to 3.8%, its worst in nearly one year. During the last ten years there has been a 32% correlation between the change in the German leading index and the quarterly change in GDP volume. Weakness in the leaders has been led by a negative interest rate spread, an easier business climate and lower export orders.
In France a modest 0.15% gain pulled the series' six month growth rate down to 2.4%. During the last ten years there has been a 54% correlation between the leaders' growth rate and growth in France's real GDP, up 4.7% (AR, 2.6% y/y) last quarter. Consumer confidence has been negative and interest rate spreads have flattened. Industrial sector prospects, however, improved.
The Italian leading index fell a sharp 1.0%, the fourth m/m decline this year, which lowered the series' six month growth rate to a negative 1.7%, the worst in nearly a year. Consumer confidence was negative, again, and the future tendency of order books deteriorated.
The U.S. leading indicators were unchanged m/m and failed to rise for the fourth consecutive month dropping the six month growth rate to 1.6%, the lowest growth rate in nearly a year. Most of the leading component series fell including consumer sentiment, construction starts, new orders for durable goods and interest rate spreads. The correlation between the leaders' growth rate and U.S. real GDP growth has been a high 73% during the last ten years.
The UK leaders increased slightly but have shown little gain during the last three months. That dropped the six month growth rate 1.2% but it still was improved from the slightly negative growth during last year. During the last ten years there has been a 36% correlation between the leaders' growth rate and U.K. real GDP growth.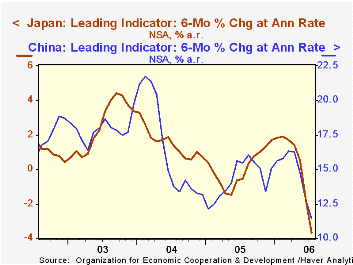
The Canadian leaders rose a sharp 0.8% after a firm 0.5% gain in June. The index's six month growth rate thus improved to 3.2%, its best in two years. The correlation of the leaders' growth with Canadian real GDP has been 49% during the last ten years.
The leading index in Japan fell a hard 1.05% for the fifth consecutive monthly decline which dropped the index's six month growth rate to -3.7%. Share prices, interest rate spreads and construction starts all are down from their highs. The leaders' correlation with Japan's real economic growth has been a meaningful 41% during the last ten years.
The latest OECD Leading Indicator report can be found here.
International Financial Integration and the Current Account Balance from the Federal reserve Bank of San Francisco is available here.
| OECD | July | June | Y/Y | 2005 | 2004 | 2003 |
|---|---|---|---|---|---|---|
| Composite Leading Index | 104.71 | 104.99 | 1.8% | 102.90 | 102.43 | 98.06 |
| 6 Month Growth Rate | 0.8% | 1.6% | 0.7% | 3.4% |
by Louise Curley September 11, 2006
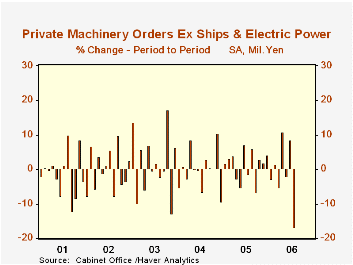
Instead of expectations of a modest decline in July, private machinery orders excluding ships and utilities (Headline Series) in Japan fell by 16.7% from June. This was the largest drop in this volatile series over the past five and one-half years as shown in the first chart.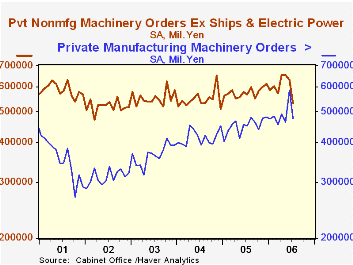
The components of the headline series-- manufacturing machinery, declined 18.7% in July from June and nonmanufacturing excluding ships and utilities, 15.8%. When plotted on a log scale, which equalizes percentage changes and thus gives a better idea of trends, manufacturing orders show a strong positive trend and nonmanufacturing excluding ships and utilities shows no significant trend as can be seen in the second chart.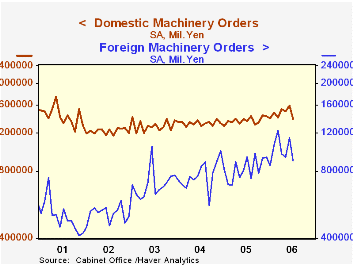
In addition to the Headline Series, most of the other series pertaining to machinery orders declined significantly in July. Total orders fell 16.0%, domestic orders for machinery fell 12.6% and foreign orders fell 21.4%. Again, when plotted on a log scale, domestic and foreign orders show different trends with domestic orders showing no significant trend up or down, while foreign orders, although more volatile than domestic orders, showing an upward trend since early 2002.
| Japan Machinery Orders (Billion Yen) | Jul 06 | Jun 06 | Jul 05 | M/M% | Y/Y% | 2005% | 2004% | 2003% |
|---|---|---|---|---|---|---|---|---|
| Headline Series | 1,009.1 | 1,211.4 | 1,020.3 | -16.70 | -1.09 | 6.74 | 4.41 | 11.08 |
| Manufacturing | 475.7 | 584.9 | 453.3 | -18.67 | 4.95 | 8.90 | 13.16 | 17.53 |
| Nonmanufacturing ex Ships and Utilities | 532.4 | 632.5 | 567.9 | -15.84 | -6.25 | 5.19 | -1.38 | 6.80 |
| Total Orders | 2,380.1 | 2,834.6 | 2,402.5 | -16.03 | -0.93 | 3.90 | 4.91 | 15.20 |
| Foreign | 892.0 | 1,134.4 | 937.3 | -21.6 | -4.32 | 6.85 | 9.43 | 37.08 |
| Domestic | 1,382.4 | 1,581.5 | 1,355.9 | -12.59 | 1.96 | 2.65 | 2.70 | 5.96 |

Tom Moeller
AuthorMore in Author Profile »Prior to joining Haver Analytics in 2000, Mr. Moeller worked as the Economist at Chancellor Capital Management from 1985 to 1999. There, he developed comprehensive economic forecasts and interpreted economic data for equity and fixed income portfolio managers. Also at Chancellor, Mr. Moeller worked as an equity analyst and was responsible for researching and rating companies in the economically sensitive automobile and housing industries for investment in Chancellor’s equity portfolio. Prior to joining Chancellor, Mr. Moeller was an Economist at Citibank from 1979 to 1984. He also analyzed pricing behavior in the metals industry for the Council on Wage and Price Stability in Washington, D.C. In 1999, Mr. Moeller received the award for most accurate forecast from the Forecasters' Club of New York. From 1990 to 1992 he was President of the New York Association for Business Economists. Mr. Moeller earned an M.B.A. in Finance from Fordham University, where he graduated in 1987. He holds a Bachelor of Arts in Economics from George Washington University.
More Economy in Brief


