 Global| Jan 09 2006
OECD Leaders Rose Broadly Amongst Member Countries
by:Tom Moeller
|in:Economy in Brief
Summary
The 0.6% rise in the November Leading Index of the Major 7 OECD economies was the sixth consecutive monthly increase. The rise lifted the leaders' six month growth rate to 2.7%, the best since July 2004. During the last ten years [...]
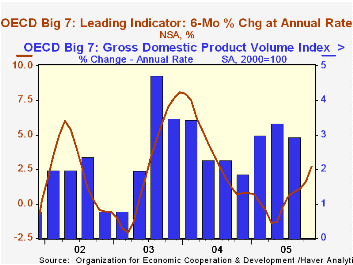
The 0.6% rise in the November Leading Index of the Major 7 OECD economies was the sixth consecutive monthly increase. The rise lifted the leaders' six month growth rate to 2.7%, the best since July 2004.
During the last ten years there has been a 66% correlation between the change in the leading index and the q/q change in the GDP Volume Index for the Big Seven countries in the OECD.
The leaders in Japan again paced the gains which were broad based amongst countries. A 1.0% November rise was the largest since 2002 and the sixth consecutive monthly increase. The six month growth rate rose to 4.1% and its correlation with real economic growth in Japan has been a meaningful 42% during the last ten years.
The 0.7% rise in the U.S. leaders was the firmest since June and raised six month growth in the leaders to 2.4%, also the best since August of last year. The correlation between the leaders and real GDP growth has been a high 58% during the last ten years.
The Canadian leaders showed improvement. A 0.6% gain followed an upwardly revised 0.3% October increase and pulled six month growth positive for the first time in over a year at 0.9%. The correlation of the leaders' growth with Canadian real GDP has been 49% during the last ten years.
Leaders in the European Union (15 countries) again rose by 0.4%, the sixth consecutive monthly increase and it raised the six month growth rate to 3.2%. During the last ten years there has been a 60% correlation between the change in the leading index and the q/q change in the GDP volume index for the European Union.
German leaders increased 0.8% for the second month. This seventh consecutive rise raised the six month growth rate to 5.8% but the correlation between the leaders and the change in the German GDP volume index has been a low 19% during the last ten years.
The French leaders gained 0.4% and pulled the six month growth rate 2.6%, its best in a year. The correlation between the leaders' growth and France's GDP volume index has been 43% during the last ten years. The Italian leading index even managed 0.1% up tick but the six month growth remained negative at -0.6% following downwardly revised figures in earlier months. The leaders' correlation with GDP growth has been a low 0.9% during the last ten years.
Also to the weak side, the UK leaders fell 0.1% for the third straight month led by lower consumer confidence and new car registrations but share prices rose. The six month growth rate remained negative for the twelfth straight month at -0.2% and its correlation with real GDP growth has been 29% during the last ten years.
The latest OECD Leading Indicator report is available here.
| OECD | Nov | Oct | Y/Y | 2004 | 2003 | 2002 |
|---|---|---|---|---|---|---|
| Composite Leading Index | 104.01 | 103.34 | 1.4% | 102.39 | 97.87 | 96.47 |
| 6 Month Growth Rate | 2.7% | 1.6% | 3.6% | 2.7% | 2.4% |
by Louise Curley January 9, 2006
Statistics relating to the Czech Republic, Hungary, Latvia and Slovenia were released today. These countries became members of the European Union in May, 2004 and, while it will be some time before they are able and/or willing to join the Euro Zone, it may be interesting to compare the various aspects of their economies with those of the Euro Zone as a whole. The data for these countries are found in the Haver data base, EMERGECW.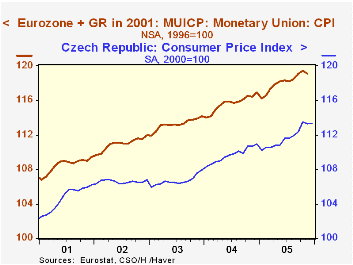
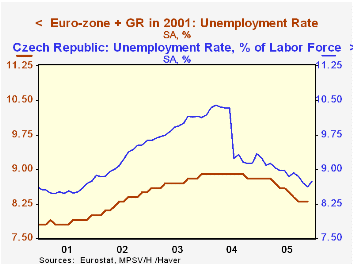
The December CPI and the unemployment rate were released for the Czech Republic. The first two charts compare prices and the unemployment rate in the Czech Republic and in the Euro Zone as a whole. When the harmonized Index of Prices for the Euro Zone, which is published on a 1996=100 basis is put on a 2000=100 basis for comparison with the Czech index, the levels and trends are very similar. The rate of unemployment, however, is higher in the Czech Republic than in the Euro Zone and it was only in mid 2004 that the difference between the two rates began to narrow.
Industrial production in Latvia rose 4.9% in November from October and was almost 6% over November, 2004. As shown in the third chart, the rise in production in Latvia has been much more vigorous than that in the Euro Zone as a whole.
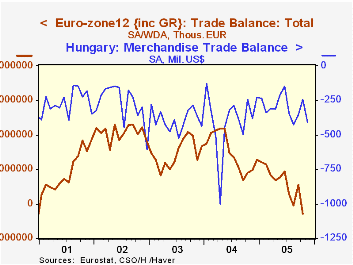
Finally the merchandise trade balance in both Slovenia and Hungary has generally been negative, while that of the Euro Zone has, until recently, been positive. The fourth chart shows the merchandise trade deficit for Hungary and that of the Euro Zone as a whole. 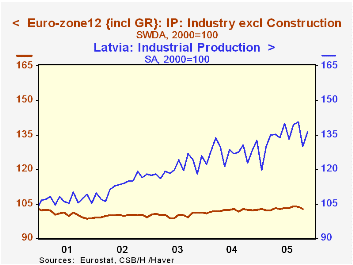
| Dec 05 | Nov 05 | Dec 04 | M/M % or Dif | Y/Y % or Dif |
2004 | 2003 | 2002 | |
|---|---|---|---|---|---|---|---|---|
| CZECH REPUBLIC | ||||||||
| CPI (2000=100) | 113.4 | 113.3 | 110. | 0.09 | 2.25 | 109.7 | 106.7 | 106.6 |
| Unemployment Rate (%) | 8.75 | 8.63 | 9.34 | 0.12 | -0.59 | 9.77 | 9.92 | 9.19 |
| Nov 05 | Oct 05 | Nov 04 | M/M % or Dif | Y/Y % or Dif | 2004 | 2003 | 2002 | |
| LATVIA | ||||||||
| Industrial Production | 136.2 | 129.2 | 128.6 | 4.93 | 5.99 | 127.7 | 120.5 | 113.1 |
| HUNGARY | ||||||||
| Trade Balance (Mil US$) | -411.7 | -245.4 | -378.7 | -166.3 | -33.0 | -4764.8 | -4667.3 | -3275.1 |
| SLOVENIA | ||||||||
| Trade Balance (Mil US$) | -192.7 | -156.9 | -143.2 | -35.8 | -49.5 | -1456.5 | -1120.7 | -586.5 |

Tom Moeller
AuthorMore in Author Profile »Prior to joining Haver Analytics in 2000, Mr. Moeller worked as the Economist at Chancellor Capital Management from 1985 to 1999. There, he developed comprehensive economic forecasts and interpreted economic data for equity and fixed income portfolio managers. Also at Chancellor, Mr. Moeller worked as an equity analyst and was responsible for researching and rating companies in the economically sensitive automobile and housing industries for investment in Chancellor’s equity portfolio. Prior to joining Chancellor, Mr. Moeller was an Economist at Citibank from 1979 to 1984. He also analyzed pricing behavior in the metals industry for the Council on Wage and Price Stability in Washington, D.C. In 1999, Mr. Moeller received the award for most accurate forecast from the Forecasters' Club of New York. From 1990 to 1992 he was President of the New York Association for Business Economists. Mr. Moeller earned an M.B.A. in Finance from Fordham University, where he graduated in 1987. He holds a Bachelor of Arts in Economics from George Washington University.
More Economy in Brief


