 Global| Mar 08 2004
OECD Leaders Rose Again
by:Tom Moeller
|in:Economy in Brief
Summary
The Index of Leading Indicators for the Major Seven OECD Countries began 2004 signaling economic growth. A 0.3% (6.2% y/y) rise in January was the tenth consecutive monthly increase. Six-month growth in the leading index dipped [...]
The Index of Leading Indicators for the Major Seven OECD Countries began 2004 signaling economic growth. A 0.3% (6.2% y/y) rise in January was the tenth consecutive monthly increase.
Six-month growth in the leading index dipped slightly to a still very-strong 7.9%.
The leading index for the European Union rose just 0.2% in January but early figures for February already indicate a firmer 0.5% gain that left the six-month growth rate at a firm 6.3%.
Leaders in Germany nudged 0.2% higher in January and the six-month growth rate stayed firm at 9.0%. In France the leading index added momentum as a 0.5% gain kept the six-month growth rate at 8.0%.
Leaders in Italy again dropped. The 0.3% decline in January followed a 0.6% fall in December which was revised shallower from the initial report but it was the third decline in a row. The six-month growth in the leaders fell to 1.1%, down from recent highs near 5%.
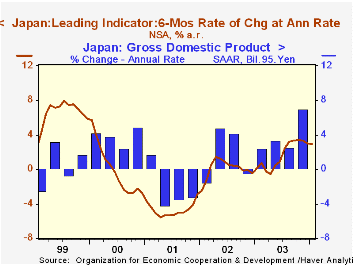
Leaders in Japan rose 0.2% leaving the six-month growth rate near 3%.
In Canada the leading index jumped another 1.1%. Six-month growth of 7.7%% was improved from -4.0% just last April. In the U.K. the leaders rose 0.6% and that pulled six-month growth to 5.9%, the strongest since mid-2002. Leading indicators in the United States edged up 0.3% following several months of huge gain so the six-month growth rate was at 11.5%.
Visit the OECD's website at this website.
| OECD Main Economic Indicators | Jan | Dec | Y/Y | 2003 | 2002 | 2001 |
|---|---|---|---|---|---|---|
| OECD Major Seven - Leading Index (Trend Restored) | 120.9 | 120.6 | 6.2% | 1.5% | 2.2% | -3.1% |
| European Union | 120.9 | 120.7 | 5.1% | 2.0% | 3.1% | -1.9% |
| Japan | 101.8 | 101.6 | 2.7% | 1.2% | -0.6% | -4.5% |
| United States | 133.4 | 133.0 | 9.0% | 1.9% | 2.7% | -3.5% |
by Tom Moeller March 8, 2004
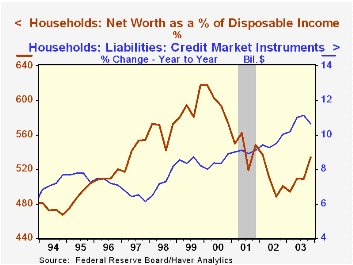
The Flow of Funds Accounts reported by the US Federal Reserve indicated that the net worth of the household sector jumped to over $44 trillion last year, up 11.7% versus 2002. The gain followed three successive years of decline.
As a percentage of disposable personal income net worth rose to 533.8% versus 501.1% in 2002. These percentages were down sharply from the peak of 617.7% set in 1999.
Strong 10.6% growth in credit market debt last year nearly kept pace with the rise in asset values.
Home mortgage liabilities surged 12.5% in 2003. That equaled the prior year's growth and was the fastest since 1986. It partially reflected the refinancing boom which held growth in consumer credit at only 5.2%, half the recent peak 11.4% growth rate in 2000. Bank loans ballooned by 76.5%, but these represent only a small fraction of financial liabilities.
Household sector assets grew 11.5% in 2003. The surging stock market pumped up holdings of corporate equities by 24.1% and holdings of mutual funds by 29.6%. In addition, the value of tangible assets jumped as real estate holding grew 10.0%, the strongest yearly gain since 1985.
| US Flow of Funds | 2003 | 3Q03 | 2002 | 2001 |
|---|---|---|---|---|
| Net Worth: Household Sector (Billion) | $44,411.2 | $42,250.6 | $39,763.2 | $41,281.3 |
| % of Disposable Income | 533.8 | 508.6 | 501.1 | 548.4 |
| Credit Market Debt Outstanding (y/y % Chg.) | ||||
| US Non-financial Sector | 8.3% | 8.5% | 7.1% | 6.3% |
| Federal Government | 10.9% | 10.6% | 7.6% | -0.2% |
| Household | 10.6% | 11.1% | 10.0% | 9.1% |
| Corporate Business | 3.4% | 3.1% | 0.8% | 4.9% |
| Total Assets: Household Sector | 11.5% | 9.9% | -1.6% | -0.1% |
| Tangible | 9.1% | 7.5% | 8.7% | 8.0% |
| Real Estate | 10.0% | 8.0% | 9.4% | 8.7% |
| Financial | 12.9% | 11.4% | -6.9% | -3.8% |

Tom Moeller
AuthorMore in Author Profile »Prior to joining Haver Analytics in 2000, Mr. Moeller worked as the Economist at Chancellor Capital Management from 1985 to 1999. There, he developed comprehensive economic forecasts and interpreted economic data for equity and fixed income portfolio managers. Also at Chancellor, Mr. Moeller worked as an equity analyst and was responsible for researching and rating companies in the economically sensitive automobile and housing industries for investment in Chancellor’s equity portfolio. Prior to joining Chancellor, Mr. Moeller was an Economist at Citibank from 1979 to 1984. He also analyzed pricing behavior in the metals industry for the Council on Wage and Price Stability in Washington, D.C. In 1999, Mr. Moeller received the award for most accurate forecast from the Forecasters' Club of New York. From 1990 to 1992 he was President of the New York Association for Business Economists. Mr. Moeller earned an M.B.A. in Finance from Fordham University, where he graduated in 1987. He holds a Bachelor of Arts in Economics from George Washington University.
More Economy in Brief


