 Global| Sep 12 2005
OECD Leaders Positive
by:Tom Moeller
|in:Economy in Brief
Summary
The July Leading Index of the Major 7 OECD economies rose 0.4%. Coming on the heels of a 0.5% June increase, the rise lifted the six month growth rate in the index to 0.5%, the first positive reading in six months. During the last ten [...]
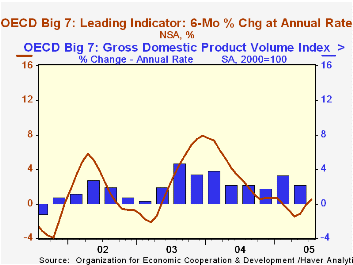
The July Leading Index of the Major 7 OECD economies rose 0.4%. Coming on the heels of a 0.5% June increase, the rise lifted the six month growth rate in the index to 0.5%, the first positive reading in six months.
During the last ten years there has been a 68% correlation between the change in the leading index and the q/q change in the GDP Volume Index for the Big Seven countries in the OECD.
A third consecutive monthly increase in the U.S. leaders raised six month growth to 1.6%, its best since last August. The Canadian leaders also managed a third increase in as many months but the six month growth rate remained negative at -1.0%.
Leaders in the European Union (15 countries) squeaked out a 0.2% increase, the second after several months of decline, and the six month growth rate turned positive (0.2%) for the first time since March.
German leaders jumped 0.7%, the most for any month in nearly two years. The gain raised six month growth to 1.2%, the first positive reading this year, and owed much to an improvement in orders inflow and a better business climate. The French leaders also rose a strong 0.6%, enough to turn the six month growth positive for the first time since March. Moving the other way, the Italian leading index fell for the ninth consecutive month due to sharp declines in consumer confidence, the future tendency of order books and production. Six month growth in the leaders dropped to -4.4%, its worst 2000.
The UK leaders rose a modest 0.2%, helped by improvement in the Financial Times Share Index, but six month growth remained negative at -0.7%. Japan leaders rose 0.6% on top of an upwardly revised like gain in June, turning six month growth positive (0.3%) for the first time since January.
The latest OECD Leading Indicator report is available here.
| OECD | July | June | Y/Y | 2004 | 2003 | 2002 |
|---|---|---|---|---|---|---|
| Composite Leading Index | 102.28 | 101.91 | 0.1% | 102.05 | 97.67 | 96.37 |
| 6 Month Growth Rate | 0.5% | -0.1% | 3.5% | 2.6% | 2.2% |
by Louise Curley September 12, 2005
The second preliminary estimate for Japanese Gross Domestic Product in the second quarter was significantly higher than that shown in the first estimate released August 12. Total GDP is now estimated to have risen 3.3% at an annual rate in the second quarter compared to the earlier estimate of 1.1%. The major causes of the increased momentum in the economy were higher estimates of activity in the business sector. Plant and equipment expenditures which earlier were estimated to have increased at an annual rate of 9.0% are now estimated to have increased 15.4%. At the same time, inventory liquidation is now estimated to be about one third as large as previously estimated--3,538.8 billion 2000 chained yen at an annual rate versus 10,892.4 billion 2000 chained yen. Details of the first and second estimates are shown in the table below.
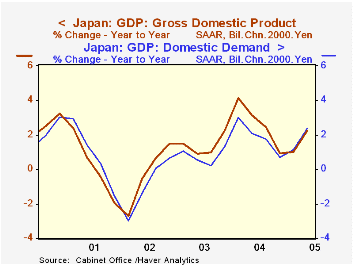
As a result of the strength in the business sector, domestic demand is now estimated to have risen at annual rate of 2.43% compared with the earlier estimate of 0.36%, in spite of a reduction in the estimated annual rate of increase in private consumption from 3.03% to 2.42%. Moreover, the increase in domestic demand over a year ago is slightly above the increase in total GDP for the second time since early 2002 as can be seen in the attached chart.
While the revised figures depict a stronger second quarter than previously estimated, the second quarter growth is still below that of the first quarter when the economy rose at an annual rate of 5.75%. The continued positive growth is, however, in sharp contrast to the experience of 2004 when both the second and third quarters showed decreases in activity.
| Percent Change at an Annual Rate | Q2 05 1st Est. | Q2 05 2nd Est. | 2004 | 2003 | 2002 |
|---|---|---|---|---|---|
| Gross Domestic Product | 1.07 | 3.26 | 2.63 | 1.41 | -0.29 |
| Private Consumption | 3.03 | 2.42 | 1.47 | 0.24 | 0.53 |
| Government Consumption | -0.66 | 1.00 | 2.66 | 1.19 | 2.63 |
| Gross Fixed Investment | 3.43 | 6.50 | 1.43 | 1.04 | -5.67 |
| Private Plant & Equipment | 9.02 | 15.37 | 5.76 | 6.58 | -6.58 |
| Change in Private Inventories* | -10892.4 | -3538.8 | 948.2 | 875.9 | -1053.2 |
| Change in Public Inventories* | -106.6 | -106.6 | 39.2 | 9.3 | 18.8 |
| Exports | 11.57 | 12.12 | 14.7 | 9.09 | 7.15 |
| Imports | 6.69 | 6.00 | 8.91 | 3.82 | 1.24 |
| Domestic Demand | 0.36 | 2.43 | 1.86 | 0.78 | -0.81 |
| *Change in Billions of Chained 2000 Yen at an Annual Rate |

Tom Moeller
AuthorMore in Author Profile »Prior to joining Haver Analytics in 2000, Mr. Moeller worked as the Economist at Chancellor Capital Management from 1985 to 1999. There, he developed comprehensive economic forecasts and interpreted economic data for equity and fixed income portfolio managers. Also at Chancellor, Mr. Moeller worked as an equity analyst and was responsible for researching and rating companies in the economically sensitive automobile and housing industries for investment in Chancellor’s equity portfolio. Prior to joining Chancellor, Mr. Moeller was an Economist at Citibank from 1979 to 1984. He also analyzed pricing behavior in the metals industry for the Council on Wage and Price Stability in Washington, D.C. In 1999, Mr. Moeller received the award for most accurate forecast from the Forecasters' Club of New York. From 1990 to 1992 he was President of the New York Association for Business Economists. Mr. Moeller earned an M.B.A. in Finance from Fordham University, where he graduated in 1987. He holds a Bachelor of Arts in Economics from George Washington University.
More Economy in Brief


