 Global| Jan 13 2003
OECD Leaders On the Mend?
by:Tom Moeller
|in:Economy in Brief
Summary
The OECD Index of Leading Indicators rose in November for the first month since May as a result of improvement in Continental Europe and in the US. Leaders in the UK and Japan continued a recent decline. Real economic growth in the [...]
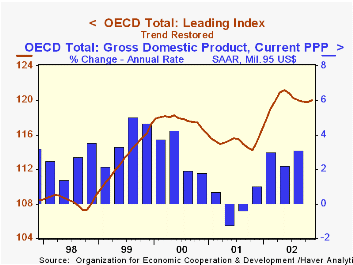
The OECD Index of Leading Indicators rose in November for the first month since May as a result of improvement in Continental Europe and in the US. Leaders in the UK and Japan continued a recent decline.
Real economic growth in the Major Seven OECD countries improved in 3Q as a result of respectable growth in the UK, the US and in Japan.
In Germany, real GDP growth was modest as industrial production fell hard in October for the fourth month in five. Retail sales volumes staged a modest recovery in November (-1.9% y/y) from a sharp October drop and were flat in 3Q. Harmonized consumer prices fell 0.5% in November and are down 0.7% from a July peak.
In the UK, production was flat in October following two months of moderate decline. Retail sales values were unchanged in November (3.2% y/y). Consumer prices were flat in November following little change in the months prior.
Production in France was erratic last year and showed little change through October. The leading indicators rose in November following five months of decline. Retail sales volumes have been firm (+2.5% y/y) and consumer prices fell in November (+2.1% y/y).
Production in Japan fell in October (5.5% y/y) for the second consecutive month. Retail sales values rose 2.2% in November and have moved sideways since the Spring. Prices actually rose in November (-0.3% y/y) for the first month in five.
| OECD Main Economic Indicators | Nov | Oct | Y/Y | 2001 | 2000 | 1999 |
|---|---|---|---|---|---|---|
| OECD Total - Leading Index (Trend Restored) | 120.1 | 119.8 | 4.2% | -2.1% | 3.7% | 4.7% |
| 3Q02 | 2Q02 | |||||
| OECD Total | 3.1% | 2.2% | 2.3% | 0.8% | 3.8% | 3.2% |
| Major Seven - GDP (Mil. 95 US$, SAAR) | 3.1% | 1.8% | 2.2% | 0.7% | 3.4% | 3.0% |
| European Union - GDP (Mil. 95 US$, SAAR) | 1.7% | 1.7% | 1.1% | 1.6% | 3.6% | 2.8% |
| Germany - GDP (Bil. 95 Euros, SAAR) | 1.1% | 0.6% | 0.4% | 0.7% | 3.1% | 1.9% |
| United Kingdom - GDP (Mil. 95 Pounds, SAAR) | 3.8% | 2.6% | 2.1% | 2.0% | 3.1% | 2.4% |
| Japan - GDP (Bil. 95 Yen, SAAR) | 3.0% | 4.2% | 1.5% | -0.9% | 2.2% | 0.7% |

Tom Moeller
AuthorMore in Author Profile »Prior to joining Haver Analytics in 2000, Mr. Moeller worked as the Economist at Chancellor Capital Management from 1985 to 1999. There, he developed comprehensive economic forecasts and interpreted economic data for equity and fixed income portfolio managers. Also at Chancellor, Mr. Moeller worked as an equity analyst and was responsible for researching and rating companies in the economically sensitive automobile and housing industries for investment in Chancellor’s equity portfolio. Prior to joining Chancellor, Mr. Moeller was an Economist at Citibank from 1979 to 1984. He also analyzed pricing behavior in the metals industry for the Council on Wage and Price Stability in Washington, D.C. In 1999, Mr. Moeller received the award for most accurate forecast from the Forecasters' Club of New York. From 1990 to 1992 he was President of the New York Association for Business Economists. Mr. Moeller earned an M.B.A. in Finance from Fordham University, where he graduated in 1987. He holds a Bachelor of Arts in Economics from George Washington University.
More Economy in Brief


