 Global| Jun 14 2005
OECD Leaders Fell Broadly Again
by:Tom Moeller
|in:Economy in Brief
Summary
The Leading Index of the Major 7 OECD economies fell for the third straight month, off 0.5%, the declines growing larger each month. The drop lowered the six month growth rate in the index to a negative 1.6%, the weakest in two years. [...]
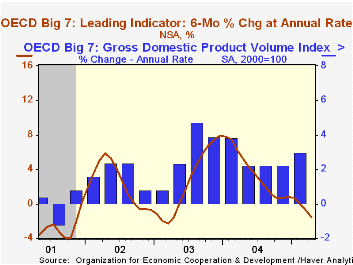
The Leading Index of the Major 7 OECD economies fell for the third straight month, off 0.5%, the declines growing larger each month. The drop lowered the six month growth rate in the index to a negative 1.6%, the weakest in two years.
During the last ten years there has been a 69% correlation between the change in the leading index and the q/q change in the GDP Volume Index for the Big Seven countries in the OECD.
The leaders for the European Union (15 countries) declined for the fourth month in the last five and the six month growth rate went negative for the first time in two years. The German leaders fell hard for the third straight month, by 0.4%, and are down 1.3% from the peak last August due to continued weakness in new orders, a negative yield curve and a worsening business climate. The six month growth rate fell to -2.0%, the worst in three and a half years. The French leaders dropped a large 0.8%, after upward revisions to earlier months, pulling the six month growth further into negative territory as consumer confidence plummeted and new car registrations fell. The Italian leading index fell for the sixth consecutive month and the six month growth rate dropped to -1.6% due to souring consumer confidence and weaker order books.
The UK economic leaders fell a sharp 0.5% and are off 1.9% from the peak in February 2004. Six month growth fell to -1.9% due to a collapse in consumer confidence and higher interest rates.The Canadian leaders also fell with six month growth down to -3.5%, the worst in two years. The yield curve is sharply inverted but housing starts recently bounced upward.
The leading index for the US economy fell for the third straight month and six month growth was sharply negative at -1.7% due to a tighter yield curve and weaker consumer sentiment. The leaders for Japan fell for the fifth straight month and six month growth of negative 1.2% was the worst since early 2002.
The latest OECD Leading Indicator report can be found here.
| OECD | April | March | Y/Y | 2004 | 2003 | 2002 |
|---|---|---|---|---|---|---|
| Composite Leading Index | 101.17 | 101.67 | -0.8% | 102.05 | 97.55 | 96.34 |
| 6 Month Growth Rate | -1.6% | -0.8% | 3.6% | 2.5% | 2.3% |
by Tom Moeller June 14, 2005
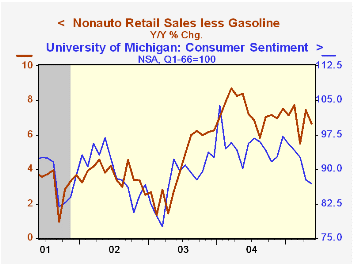
US retail sales slipped 0.5% last month following a little revised 1.5% spurt in April. Consensus expectations had been for a 0.2% decline.
The 0.2% decline in sales excluding motor vehicles followed an upwardly revised 1.4% jump in April. Consensus expectations had been for a 0.2% increase. Some of the weakness was due to a 1.6% decline in gasoline service station sales (+13.4% y/y). Nonauto retail sales less gasoline in May were about unchanged (6.6% y/y).
Spending on discretionary items was quite mixed. General merchandise store sales fell 0.1% (+4.9% y/y) after a sharp 1.3% jump in April. Apparel store sales dropped 0.8% (+5.8% y/y) but sales at furniture and electronics sales increased 0.2% (+6.7% y/y).
Building material store sales added 0.5% (9.2% y/y) to the very sharp increases of the prior two months.
Sales of nonstore retailers (internet and catalogue) dropped 1.1% (11.9% y/y) but April's gain was revised sharply higher to 1.2%.
| May | April | Y/Y | 2004 | 2003 | 2002 | |
|---|---|---|---|---|---|---|
| Retail Sales & Food Services | -0.5% | 1.5% | 6.4% | 7.3% | 4.3% | 2.5% |
| Excluding Autos | -0.2% | 1.4% | 7.4% | 8.3% | 4.7% | 3.3% |
by Tom Moeller June 14, 2005
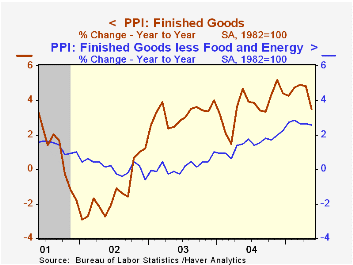
The 0.6% decline in the May Producer Price Index for finished goods was triple Consensus expectations for a 0.2% fall and the 0.1% increase in prices excluding food & energy also was half the Consensus expectation.
Finished energy prices dropped 3.5% (+10.1% y/y) due to a 2.7% (+12.5% y/y) decline in gasoline and a 3.9% drop in fuel oil (44.4% y/y). Finished food prices also fell by 0.3% (+0.8% y/y).
Prices for finished consumer goods less food & energy rose a modest 0.1% (2.6% y/y). Consumer durable goods prices slipped 0.1% (+1.3% y/y) while core consumer nondurable goods prices rose 0.3% (3.6% y/y).
Capital goods prices ticked 0.1% (2.6% y/y) higher.
Intermediate goods prices fell hard due to a 2.6% (+14.0% y/y) drop in energy prices though food prices rose a moderate 0.4% (-8.4% y/y). The decline in core intermediate goods prices was the first since 2003.
Crude prices slumped with oil prices which pulled crude energy prices down 1.9% (+20.1% y/y) after a 7.2% jump in April. The 3.6% crater in core crude prices reversed more than all of the gains during the prior two months as metals prices fell sharply. During the last thirty years "core" crude prices have been a fair indicator of industrial sector activity with a 48% correlation between the six month change in core crude prices and the change in factory sector industrial production.
| Producer Price Index | May | April | Y/Y | 2004 | 2003 | 2002 |
|---|---|---|---|---|---|---|
| Finished Goods | -0.6% | 0.6% | 3.5% | 3.6% | 3.2% | -1.3% |
| Core | 0.1% | 0.3% | 2.6% | 1.5% | 0.2% | 0.1% |
| Intermediate Goods | -0.7% | 0.8% | 6.4% | 6.6% | 4.6% | -1.5% |
| Core | -0.3% | 0.2% | 5.4% | 5.7% | 2.0% | -0.5% |
| Crude Goods | -2.0% | 2.7% | 6.1% | 17.5% | 25.1% | -10.6% |
| Core | -3.6% | 0.8% | 9.5% | 26.6% | 12.4% | 3.8% |
by Tom Moeller June 14, 2005
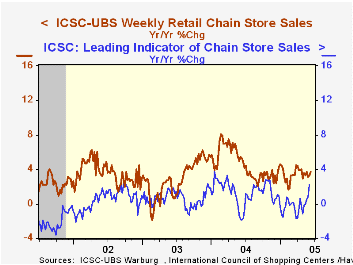
Chain store sales increased 0.6% last week and added to the 0.4% gain during the opening week of June according to the International Council of Shopping Centers (ICSC)-UBS survey. The increases left sales so far in June 0.5% below the May average which rose 0.3% versus April.
During the last ten years there has been a 56% correlation between the y/y change in chain store sales and the change in non-auto retail sales less gasoline, as published by the US Census Department. Chain store sales correspond directly with roughly 14% of non-auto retail sales less gasoline.
The leading indicator of chain store sales from ICSC jumped 0.9% w/w (+2.2% y/y), the strongest gain in a year.
The ICSC-UBS retail chain-store sales index is constructed using the same-store sales (stores open for one year) reported by 78 stores of seven retailers: Dayton Hudson, Federated, Kmart, May, J.C. Penney, Sears and Wal-Mart.
| ICSC-UBS (SA, 1977=100) | 06/11/05 | 06/04/05 | Y/Y | 2004 | 2003 | 2002 |
|---|---|---|---|---|---|---|
| Total Weekly Chain Store Sales | 452.9 | 451.2 | 3.3% | 4.6% | 2.9% | 3.6% |
by Tom Moeller June 14, 2005
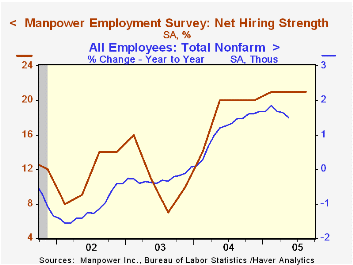
The Manpower Employment Outlook Survey for 3Q '05 indicated further growth in U.S. jobs. The index of hiring intentions held at 21 where it has been for three quarters, indicating that a net 21% of 16,000 employers expect to increase hiring activity.
Since 1980 there has been a 74% correlation between the Manpower index and the y/y change in non-farm payrolls.
Not seasonally adjusted, 31% of employers planned to raise employment in 3Q '05, the highest since late 2000, while only 6% planned to decrease employment.
The latest press release from Manpower Inc. covering global employment prospects can be viewed here.
| Manpower Employment Survey | 3Q '05 | 2Q '05 | 3Q '04 | 2004 | 2003 | 2002 |
|---|---|---|---|---|---|---|
| All Industries - Net Higher (SA) | 21 | 21 | 20 | 19 | 11 | 11 |
by Tom Moeller June 14, 2005
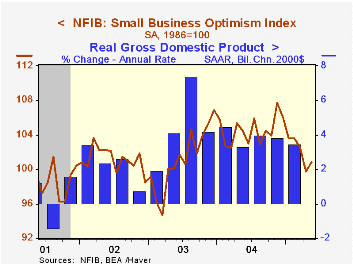
The Small Business Optimism Index reported by the National Federation of Independent Business (NFIB) improved 1.0% in May and recovered less than a third of the prior month's decline. The percentage of firms expecting the economy to improve remained unchanged at a low 5%.
During the last ten years there has been a 64% correlation between the level of the NFIB index and the two quarter change in real GDP.
The job outlook brightened a bit as the percentage of firms planning to raise employment rose to 15% but remained down from the 20% of December 2003. The percentage of firms with one or more job openings remained stable at 23% which was up from the low of 18% during 2003. During the last ten years there has been a 67% correlation between hiring plans and the three month growth in nonfarm payrolls.
The percentage of firms planning to raise capital spending ticked up to 33% but remained well off the 38% this past December.
The percentage of firms raising average selling prices remained down at 23%.
About 24 million businesses exist in the United States. Small business creates 80% of all new jobs in America.
| Nat'l Federation of Independent Business | May | April | Y/Y | 2004 | 2003 | 2002 |
|---|---|---|---|---|---|---|
| Small Business Optimism Index (1986=100) | 100.8 | 99.8 | -3.5% | 104.6 | 101.3 | 101.2 |
by Louise Curley June 14, 2005
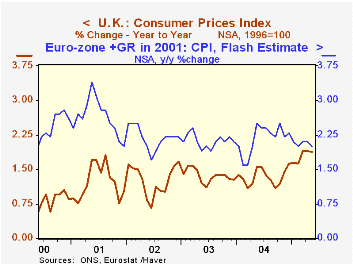
May Inflation rates in four European countries--France, Finland, Spain and the U.K. were released today. The consumer price index in the U.K. rose 1.9% continuing at the seven year high rate reached in March. In each of the Euro Zone countries the rate of inflation declined. In France from 1.9% in April to 1.6% in May, in Spain from 3.5% to 3.0% and in Finland from 1.2$ to 0.6%.
The contrast between inflation rates in the U.K. and in the Euro Zone as a whole is shown in the first chart. We have used the Flash Estimate series for the Euro Zone since it contains data for May while the overall index does not. The Flash Estimate series is a fairly good proxy for the actual series. The correlation between the two series is .86. (The actual May data for the overall index will be available on Thursday of this week.) In spite of its higher growth rate, the U. K. has had a lower inflation rate than the Euro Zone, but now the U. K. rate appears to be increasing while that in the Euro Zone is declining.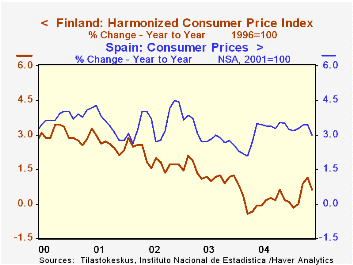
The rate of inflation within the Euro Zone has varied widely. Two of the countries reporting data today--Finland and Spain--represent two extremes and different trends in the rate of inflation as shown in the second chart. The trend in the relatively high rate of inflation in Spain appears to be stabilizing or decelerating, while the trend in the low rate of inflation in Finland shows some signs of increasing.
| Year over Year Change in CPI | May 05 | Apr 05 | Mar 04 | Feb 05 | Jan 05 | 2004 | 2003 | 2002 |
|---|---|---|---|---|---|---|---|---|
| Euro Zone Flash Estimate | 2.00 | 2.10 | 2.10 | 2.00 | 2.10 | n.a. | n.a. | n.a. |
| Euro Zone Overall Index | n.a. | 2.08 | 2.09 | 2.10 | 1.93 | 2.14 | 2.07 | 2.25 |
| United Kingdom | 1.89 | 1.89 | 1.90 | 1.63 | 1.63 | 1.34 | 1.36 | 1.27 |
| France | 1.63 | 1.91 | 1.91 | 1.73 | 1.46 | 2.13 | 2.14 | 1.88 |
| Spain | 2.99 | 3.46 | 3.47 | 3.26 | 3.17 | 3.05 | 3.03 | 3.53 |
| Finland | 0.62 | 1.15 | 0.88 | 0.00 | -0.14 | 0.14 | 1.30 | 2.01 |

Tom Moeller
AuthorMore in Author Profile »Prior to joining Haver Analytics in 2000, Mr. Moeller worked as the Economist at Chancellor Capital Management from 1985 to 1999. There, he developed comprehensive economic forecasts and interpreted economic data for equity and fixed income portfolio managers. Also at Chancellor, Mr. Moeller worked as an equity analyst and was responsible for researching and rating companies in the economically sensitive automobile and housing industries for investment in Chancellor’s equity portfolio. Prior to joining Chancellor, Mr. Moeller was an Economist at Citibank from 1979 to 1984. He also analyzed pricing behavior in the metals industry for the Council on Wage and Price Stability in Washington, D.C. In 1999, Mr. Moeller received the award for most accurate forecast from the Forecasters' Club of New York. From 1990 to 1992 he was President of the New York Association for Business Economists. Mr. Moeller earned an M.B.A. in Finance from Fordham University, where he graduated in 1987. He holds a Bachelor of Arts in Economics from George Washington University.
More Economy in Brief


