 Global| Jun 05 2007
Non MFG ISM strength is cycling higher—so are prices
Summary
The NonMFG ISM shows that its components are indeed cycling higher. Prices are up strongly. Backlogs while below the neutral value of 50 are nonetheless rising strongly from their six month average. Still, they edged lower in the [...]
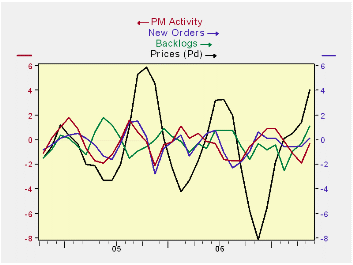
The NonMFG ISM shows that its components are indeed cycling higher. Prices are up strongly. Backlogs while below the neutral value of 50 are nonetheless rising strongly from their six month average. Still, they edged lower in the month of May. Orders also are edging higher. And activity is firming but not yet stronger on a three-month vs six month comparison.
In May the Non MFG ISM activity index moved up sharply. Orders also rose briskly. The report generated exactly the sort of strength we thought we would see after seeing employment strength in May.
The percentile positions of the various ISM components show a great deal of variation in the various ISM components (see table below). For the most part the readings are strong but not all are. The supplier deliveries reading, for example is in the bottom 12 percentile of its range and shows the same sort of slack or absence of tension on deliveries as the ISM MFG and other regional reports. Even as activity has ramped up slack has increased. Contrarily exports and inventories are at the top of their respective ranges going back to 1998. Activity is high in its range. Orders, prices and employment are at firm relative readings (Percentiles). While prices are 10 % above their average value, they has such large variation (std dev= 8.2) that they are still at a moderate position within their range of values.
Private non MFG jobs statistics are at the bottom of this table. Readings (monthly changes in non MFG jobs) are in the 65th percentile of their range since 1998 close to the 68.8 percentile for the Non Mfg ISM job diffusion reading. We appear to be getting consistent signals about the growing strength and firmness of the economy.
| ISM Non Manufacturing Statistics from Jan 1998 to Date | ||||||||||
|---|---|---|---|---|---|---|---|---|---|---|
| ISM-Non MFG | Current | Last Mo | Std Dev | Average | SD% Avg | MAX | MIN | Range | Percentile | % of AVG |
| PM Activity | 59.7 | 56.0 | 4.7 | 57.6 | 8.2 | 67.9 | 40.5 | 27.4 | 70.1 | 104 |
| New Orders | 57.4 | 55.5 | 4.7 | 57.2 | 8.2 | 66.9 | 41.3 | 25.6 | 62.9 | 100 |
| Backlogs | 48.0 | 50.0 | 3.7 | 51.0 | 7.2 | 57.0 | 40.5 | 16.5 | 45.5 | 94 |
| Supplier Deliveries | 49.5 | 51.0 | 2.2 | 53.6 | 4.1 | 60.5 | 48.0 | 12.5 | 12.0 | 92 |
| Inventory Sentiment* | 61.0 | 60.5 | 2.7 | 63.0 | 4.3 | 69.0 | 55.0 | 14.0 | 42.9 | 97 |
| Inventories | 61.0 | 52.0 | 3.3 | 50.6 | 6.6 | 61.0 | 43.5 | 17.5 | 100.0 | 121 |
| Prices | 66.4 | 63.5 | 8.2 | 60.1 | 13.6 | 80.5 | 41.3 | 39.2 | 64.0 | 110 |
| Employment | 54.9 | 51.9 | 3.7 | 51.7 | 7.1 | 59.9 | 43.9 | 16.0 | 68.8 | 106 |
| Export Orders | 66.0 | 55.5 | 4.6 | 55.0 | 8.4 | 66.0 | 44.5 | 21.5 | 100.0 | 120 |
| Import Orders | 55.5 | 52.5 | 4.0 | 54.8 | 7.3 | 63.5 | 45.5 | 18.0 | 55.6 | 101 |
| Private Non MFG jobs | 154.0 | 98.0 | 112.5 | 99.6 | 113.0 | 346.0 | -202.0 | 548.0 | 65.0 | 155 |

Robert Brusca
AuthorMore in Author Profile »Robert A. Brusca is Chief Economist of Fact and Opinion Economics, a consulting firm he founded in Manhattan. He has been an economist on Wall Street for over 25 years. He has visited central banking and large institutional clients in over 30 countries in his career as an economist. Mr. Brusca was a Divisional Research Chief at the Federal Reserve Bank of NY (Chief of the International Financial markets Division), a Fed Watcher at Irving Trust and Chief Economist at Nikko Securities International. He is widely quoted and appears in various media. Mr. Brusca holds an MA and Ph.D. in economics from Michigan State University and a BA in Economics from the University of Michigan. His research pursues his strong interests in non aligned policy economics as well as international economics. FAO Economics’ research targets investors to assist them in making better investment decisions in stocks, bonds and in a variety of international assets. The company does not manage money and has no conflicts in giving economic advice.
More Economy in Brief


