 Global| May 24 2006
New Orders for U.S. Durable Goods Fell
by:Tom Moeller
|in:Economy in Brief
Summary
New orders for durable goods fell 4.8% last month, giving back much of the upwardly revised 6.6% March increase. Nevertheless, durable orders in April remained up 11.3% versus last year and for the first four months of this year [...]
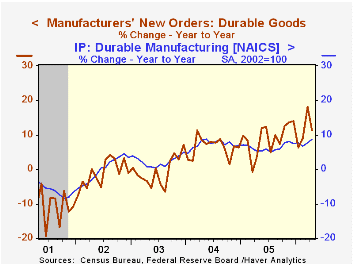
New orders for durable goods fell 4.8% last month, giving back much of the upwardly revised 6.6% March increase. Nevertheless, durable orders in April remained up 11.3% versus last year and for the first four months of this year orders also were 11.2% ahead of 2005. Consensus expectations had been for a 0.5% April decline.
During the last ten years there has been a 69% correlation between the y/y change in durable goods orders and the change in output of durable goods.
A 32.2% (+99.5% y/y) drop in orders for nondefense aircraft & parts led last month's decline in total orders. In addition, new orders for motor vehicles & parts dropped 1.6% (+2.1% y/y).
Less the transportation sector altogether, durable goods orders fell 1.1% and gave back a piece of the upwardly revised March gain.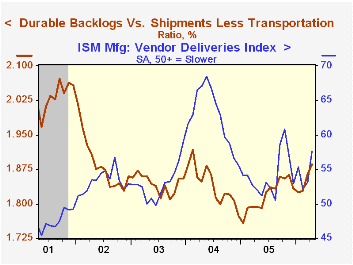
Orders for computers & electronic products gave back all of an upwardly revised March gain and fell 10.4% (+10.0% y/y). Machinery orders, however, fell just 0.2% (+12.1% y/y) after a 5.7% April increase that was little revised. Electrical equipment orders rose for the first month in three, up 5.2% (15.7% y/y), while orders for primary metals jumped 3.2% (16.6% y/y).
Orders for nondefense capital goods gave back half of the prior month's surge with a 6.0% drop while orders less aircraft fell 1.7% but remained 9.4% ahead of the year ago level. During the last ten years there has been an 86% correlation between the y/y change in capital goods orders less aircraft and the y/y change in business fixed investment in equipment & software from the GDP accounts.
Shipments of durable goods fell 0.9% (+6.0% y/y) following two months of 0.3% gain. Less the transportation sector shipments fell 0.1% (+8.1% y/y) for the second consecutive month. During the last ten years there has been an 82% correlation between the y/y change in durable goods shipments and the change in industrial production of durable goods.
Order backlogs jumped 1.5% (23.0% y/y), again reflecting a surge in nondefense aircraft & parts (75.1% y/y). Less transportation backlogs were strong again and posted a 1.1% (13.7% y/y) rise. The ratio of backlogs to shipments outside of transportation jumped to the highest level in two years.
Durable inventories increased 0.8% (2.9% y/y). Less transportation inventories also rose 0.8% (3.3% y/y) and the inventory to sales ratio outside of the transportation sector rose for the second month.
| NAICS Classification | April | Mar | Y/Y | 2005 | 2004 | 2003 |
|---|---|---|---|---|---|---|
| Durable Goods Orders | -4.8% | 6.6% | 11.3% | 9.0% | 6.4% | -0.6% |
| Excluding Transportation | -1.1% | 3.5% | 10.3% | 9.4% | 7.6% | -1.7% |
| Nondefense Capital Goods | -6.0% | 11.9% | 18.6% | 21.4% | 5.6% | -3.4% |
| Excluding Aircraft | -1.7% | 3.6% | 9.4% | 12.3% | 2.8% | -2.0% |
by Tom Moeller May 24, 2006
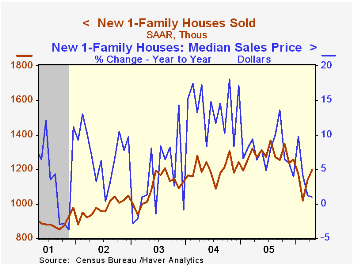
New home sales during April again posted an unexpected gain. The 4.9% m/m increase to 1.198 million (SAAR) followed a revised 12.0% rise during March which was revised down slightly. The increased contrasted to Consensus expectations for 1.15M sales.
The latest sales level was 12.4% below last July's peak and sales so far this year were 11.5% below the 2005 average.
April sales in the Northeast rose 8.2% (-33.3% y/y) and in the West sales rose 2.0% (-12.6% y/y). Sales down South (+6.7% y/y) were notably strong with a 7.8% m/m gain but sales in the Midwest fell 1.1% (-16.9% y/y).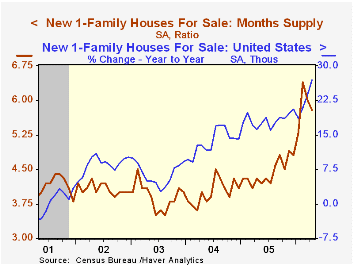
The number of homes for sale surged for the second month by 2.4% (27.0% y/y). Again in the Northeast the number of homes for sale jumped, by 1.9% (63.6% y/y).
The median sales price of a new home recovered 2.8% (0.9% y/y) following a 6.2% March decline.
| U.S. New Homes | April | March | Y/Y | 2005 | 2004 | 2003 |
|---|---|---|---|---|---|---|
| Total Sales (AR, 000's) | 1,198 | 1,142 | -5.7% | 1,280 | 1,201 | 1,091 |
| Median Price (NSA) | $238,500 | $232,000 | 0.9% | $234,208 | $217,817 | $191,383 |
by Tom Moeller May 24, 2006
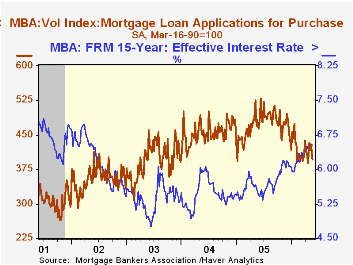
The total number of mortgage applications fell a hard 6.0% last week and pulled the average level in May 1.0% below April.
Purchase applications cratered 7.1% w/w but in May remained 0.3% ahead of April which rose 1.1% versus March.
During the last ten years there has been a negative 80% correlation between the interest rate level on 30-year financing and purchase applications while during those years there has been a 54% correlation between the y/y change in purchase applications and the change in new plus existing single family home sales.
Applications to refinance reversed about half of the prior week's rise with a 4.3% decline. The May level is 2.8% below the April average which fell 4.1% from March.
The effective interest rate on a conventional 30-year mortgage retraced all of the prior week's increase and fell back to 6.84% while the rate on 15-year financing fell to 6.52%. Rates have risen roughly 50 basis points since year end 2005. Interest rates on 15 and 30 year mortgages are closely correlated (>90%) with the rate on 10 year Treasury securities and during the last ten years there has been a (negative) 82% correlation between purchase applications and the effective rate on a 30-Year mortgage.
The Mortgage Bankers Association surveys between 20 to 35 of the top lenders in the U.S. housing industry to derive its refinance, purchase and market indexes. The weekly survey accounts for more than 40% of all applications processed each week by mortgage lenders. Visit the Mortgage Bankers Association site here.
| MBA Mortgage Applications (3/16/90=100) | 05/19/06 | 05/12/06 | Y/Y | 2005 | 2004 | 2003 |
|---|---|---|---|---|---|---|
| Total Market Index | 552.6 | 588.0 | -24.3% | 708.6 | 735.1 | 1,067.9 |
| Purchase | 396.4 | 426.7 | -9.1% | 470.9 | 454.5 | 395.1 |
| Refinancing | 1,480.5 | 1,546.8 | -31.7% | 2,092.3 | 2,366.8 | 4,981.8 |
by Carol Stone May 24, 2006
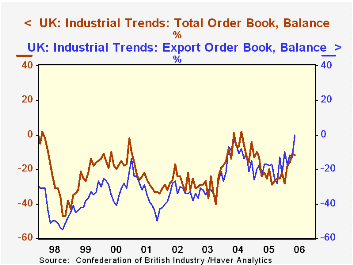
Two widely followed industrial surveys in Europe showed a slight pause in their May results, following marked improvements in the prior couple of months. They also both indicated continuing firmness in export sectors, but some hesitation in domestic activity.
The UK's Confederation of British Industry (CBI) reports that the balance on total industry orders is -12 for May, down from April's -11, but obviously much better than anytime in the previous year. Within total orders, those for exports gained dramatically, reaching a neutral value for the first time since February 1996. Thus, the UK is seeing significant and persistent improvement in export demand, but this month's gain there, combined with the decline in the overall orders balance, shows that the domestic sector faltered. In total then, the progress in manufacturing remains tenuous.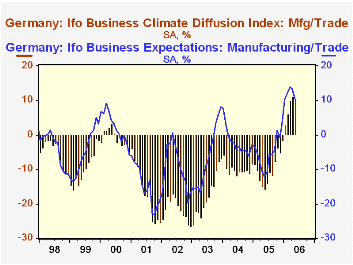
The German organization Ifo, which specializes in applied economic research, reports that in its latest survey, the overall Business Climate Index edged down to 105.6 this month from 105.9 in April (2000=100), corresponding to diffusion balance figures of +10.4% and +11.0%, respectively. As Louise Curley noted here a month ago, these are the best readings since the spring of 1991; manufacturing, despite a slight downtick this month, is experiencing the best readings in the total history of the survey.
Details are not yet available for the factors in the Ifo survey, but as shown in the table below, wholesale trade continues to gain, while retail trade has moderated. This suggests that as in the UK, domestic demand -- at least consumption -- remains fragile, while broader industry is still advancing. Businesses also report to Ifo that they are less confident about activity in the next six months; the business expectations index decreased 3 points from 13.4% in April to 10.4% in May, which also is the lowest since January. The business situation index, in contrast, continues to increase, showing that current activity is expanding at more and more firms.
We'd guess that skepticism over the outlook is related to energy prices and to the recent surge in the euro. While the latter wouldn't correspond to assessments of better export performance, it also might foster more imports, to the detriment of local industry. So, despite the recent gains in both Germany and the UK, it's not hard to understand that business leaders remain cautious.
| % Balance, SA | May 2006 | Apr 2006 | Mar 2006 | May 2005 | 2005 | 2004 | 2003 |
|---|---|---|---|---|---|---|---|
| UK CBI Total Orders | -12 | -11 | -16 | -22 | -21 | -9 | -29 |
| Export Orders | 0 | -13 | -12 | -17 | -21 | -13 | -33 |
| German Ifo Business Climate | 10.4 | 11.0 | 10.0 | -15.7 | -9.7 | -9.9 | -17.2 |
| Manufacturing | 19.4 | 20.7 | 19.2 | -5.6 | 1.2 | 4.4 | -7.9 |
| Wholesale Trade | 12.4 | 10.8 | 9.7 | -16.6 | -9.9 | -16.6 | -25.2 |
| Retail Trade | -5.7 | -5.2 | -1.8 | -35.1 | -28.0 | -30.7 | -22.5 |
| Services* | 22.5 | 23.5 | 21.0 | 4.0 | 8.1 | 6.5 | -0.4 |
Tom Moeller
AuthorMore in Author Profile »Prior to joining Haver Analytics in 2000, Mr. Moeller worked as the Economist at Chancellor Capital Management from 1985 to 1999. There, he developed comprehensive economic forecasts and interpreted economic data for equity and fixed income portfolio managers. Also at Chancellor, Mr. Moeller worked as an equity analyst and was responsible for researching and rating companies in the economically sensitive automobile and housing industries for investment in Chancellor’s equity portfolio. Prior to joining Chancellor, Mr. Moeller was an Economist at Citibank from 1979 to 1984. He also analyzed pricing behavior in the metals industry for the Council on Wage and Price Stability in Washington, D.C. In 1999, Mr. Moeller received the award for most accurate forecast from the Forecasters' Club of New York. From 1990 to 1992 he was President of the New York Association for Business Economists. Mr. Moeller earned an M.B.A. in Finance from Fordham University, where he graduated in 1987. He holds a Bachelor of Arts in Economics from George Washington University.
More Economy in Brief
 Global| Feb 05 2026
Charts of the Week: Balanced Policy, Resilient Data and AI Narratives
by:Andrew Cates


