 Global| Apr 26 2005
New Home Sales Set Another Record
by:Tom Moeller
|in:Economy in Brief
Summary
New single-family home sales set a new record in March with a 12.2% m/m jump to 1.431M following the upwardly revised 8.2% increase in February. Consensus estimates had been for sales of 1.190M. Last month's sales gain was led by a [...]
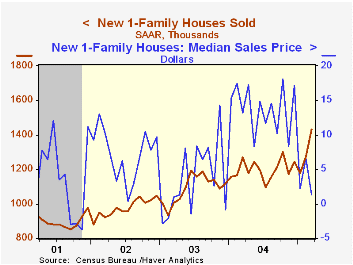
New single-family home sales set a new record in March with a 12.2% m/m jump to 1.431M following the upwardly revised 8.2% increase in February. Consensus estimates had been for sales of 1.190M.
Last month's sales gain was led by a 21.9% jump in the Midwest (13.6% y/y) and a 13.8% (18.6% y/y) rise in the South. Sales in the West also rose 9.9% (5.0% y/y) but in the Northeast sales fell 8.9% (+1.2% y/y) after a jump one third higher in February.
The median price of a new single family home gave back all of the prior month's gain and fell 9.3% to $212,300 (+1.3% y/y).
The figures from the Census Department reflect homes sold.
The cost of business cycles and the benefits of stabilization from the Federal Reserve Bank of Chicago is available here.
| Homes Sales (000s, AR) | Mar | Feb | Y/Y | 2004 | 2003 | 2002 |
|---|---|---|---|---|---|---|
| New Single-Family | 1,431 | 1,275 | 12.7% | 1,200 | 1,089 | 976 |
by Tom Moeller April 26, 2005
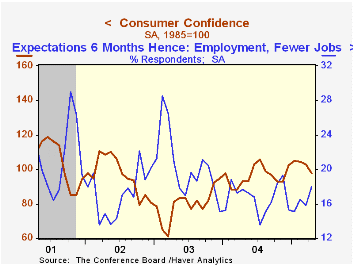
The Conference Board's April Index of Consumer Confidence about matched Consensus expectations and fell a sharp 5.1% to 97.7 from an upwardly revised March level. It was the steepest one month decline since last August and pulled Confidence to the lowest level since November.
During the last twenty years there has been a 51% correlation between the level of consumer confidence and the y/y change in real consumer spending. The correlation rose to 66% during the last ten years.
The April index of consumer expectations dropped sharply to the lowest level since August 2003. Expectations continued to grow that in six months there would be fewer jobs.
The present situation index fell (+25.7% y/y) for the first month in the last six. Jobs were viewed as hard to get by 23.3% of survey participants, down from the late 2003 high of 35.1%.
The Conference Board’s survey isconducted by a mailed questionnaire to 5,000 households and about 3,500 typically respond.
| Conference Board | April | Mar | Y/Y | 2004 | 2003 | 2002 |
|---|---|---|---|---|---|---|
| Consumer Confidence | 97.7 | 103.0 | 5.1% | 96.1 | 79.8 | 96.6 |
by Tom Moeller April 26, 2005

Chain store sales dipped 0.3% last week following a 1.0% pop the week earlier according to the International Council of Shopping Centers (ICSC)-UBS survey. With one week to go, the average of sales in April is 0.5% higher than during March.
During the last ten years there has been a 56% correlation between the y/y change in chain store sales and the change in non-auto retail sales less gasoline, as published by the US Census Department. Chain store sales correspond directly with roughly 14% of non-auto retail sales less gasoline.
The leading indicator of chain store sales from ICSC jumped 0.6% (0.6% y/y), the largest gain in ten weeks.
The ICSC-UBS retail chain-store sales index is constructed using the same-store sales (stores open for one year) reported by 78 stores of seven retailers: Dayton Hudson, Federated, Kmart, May, J.C. Penney, Sears and Wal-Mart.
Imbalances in the U.S. Economy from Federal Reserve Board Governor Donald L. Kohn can be found here.
| ICSC-UBS (SA, 1977=100) | 04/23/05 | 04/16/05 | Y/Y | 2004 | 2003 | 2002 |
|---|---|---|---|---|---|---|
| Total Weekly Chain Store Sales | 455.8 | 457.4 | 4.0% | 4.6% | 2.9% | 3.6% |
by Louise Curley April 26, 2005

The latest monthly data and results of the most recent quarterly survey of industrial trends were released today by the CBI (Confederation of British Industries). Britain's manufacturing sector has been depressed for some time, as evidence by the first chart showing the monthly percent balances of increases less decreases in new orders. Rarely have increases in orders outweighed decreases and then only by a very small margin.
There is little comfort in the monthly data for the sector. The percent balance of decreases over increases in new orders in April of 24% is the largest since November, 2003.
Nor is the survey encouraging. While the survey revealed that the respondents were slightly less pessimistic in the current quarter compared to the first quarter, they were generally more pessimistic concerning the current status and outlook for new orders, output, prices and unit costs. The percent balances for new orders and output over the past three months are shown in the second chart.
Although the manufacturing share of gross value added has declined from 24% in 1985 to 16% in 2004, a slowdown in manufacturing activity should have a significant impact on growth of the total economy.
| % Balance* | Q2 05 | Q1 05 | Q2 04 | Q/Q Dif | Y/Y Dif | 2004 | 2003 | 2002 |
|---|---|---|---|---|---|---|---|---|
| Optimism re business conditions | -15 | -22 | 12 | 7 | -27 | 7 | -17 | -6 |
| New orders past 3 months | -18 | -4 | 18 | -14 | -36 | 9 | -16 | -14 |
| New orders next 3 months | -17 | -4 | 12 | -13 | -29 | 5 | -21 | -14 |
| Output past 3 months | -10 | 2 | 15 | -12 | -25 | 11 | -12 | -13 |
| Output next 3 months | 5 | 10 | 12 | -5 | -7 | 13 | 4 | 5 |
| Unit costs past 3 months | 32 | 23 | 6 | 9 | 26 | 9 | 3 | -4 |
| Unit costs next 3 months | 18 | 19 | 5 | -1 | 13 | 7 | -1 | -7 |
| Prices past 3 months | 12 | 11 | -3 | 1 | 15 | -4 | -16 | -26 |
| Prices past 3 months | 5 | 19 | 2 | -14 | 3 | 3 | -10-13 | |
| Apr 05 | Mar 05 | Apr 04 | M/M Dif | Y/Y Dif | 2004 | 2003 | 2002 | |
| Total orders | -24 | -13 | 14 | -11 | -10 | -9 | -29 | -27 |
| Stock of finished goods | 18 | 13 | 17 | 5 | 1 | 11 | 17 | 16 |
| Vol. of output next 3 months | 5 | 9 | 12 | -4 | -7 | 12 | -3 | 5 |
| Ave prices of domestic orders next 3 months | 5 | 9 | 2 | -4 | 3 | 4 | -12 | -13 |

Tom Moeller
AuthorMore in Author Profile »Prior to joining Haver Analytics in 2000, Mr. Moeller worked as the Economist at Chancellor Capital Management from 1985 to 1999. There, he developed comprehensive economic forecasts and interpreted economic data for equity and fixed income portfolio managers. Also at Chancellor, Mr. Moeller worked as an equity analyst and was responsible for researching and rating companies in the economically sensitive automobile and housing industries for investment in Chancellor’s equity portfolio. Prior to joining Chancellor, Mr. Moeller was an Economist at Citibank from 1979 to 1984. He also analyzed pricing behavior in the metals industry for the Council on Wage and Price Stability in Washington, D.C. In 1999, Mr. Moeller received the award for most accurate forecast from the Forecasters' Club of New York. From 1990 to 1992 he was President of the New York Association for Business Economists. Mr. Moeller earned an M.B.A. in Finance from Fordham University, where he graduated in 1987. He holds a Bachelor of Arts in Economics from George Washington University.
More Economy in Brief


