 Global| Jul 27 2006
New Home Sales & Prices Fell
by:Tom Moeller
|in:Economy in Brief
Summary
Sales of new single family home sales fell 3.0% during June to 1.131M (SAAR) and the prior month's increase was revised down sharply to just 0.5%. Consensus expectations had been for June sales of 1.17M. New home sales during the [...]
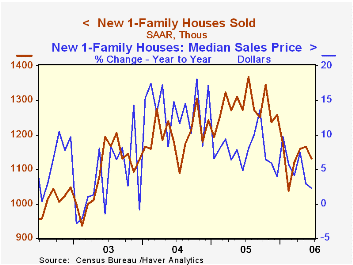
Sales of new single family home sales fell 3.0% during June to 1.131M (SAAR) and the prior month's increase was revised down sharply to just 0.5%. Consensus expectations had been for June sales of 1.17M.
New home sales during the first six months of this year fell 10.9% from the first six months of 2005 and during June were 17.3% below the monthly peak last July.
Sales in the Northeast were the weakest last month showing an 11.3% (-33.7% y/y) decline. Sales in the Midwest also fell, by 7.9% (-24.5% y/y) and sales in the South declined 6.0% (-5.2% y/y). Sales out West posted the only regional gain with an 8.2% increase but nevertheless were off 7.0% y/y.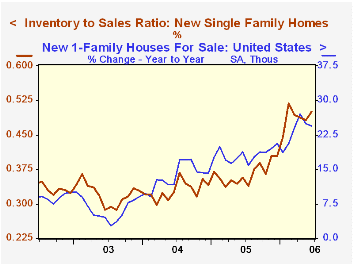
The number of new homes for sale advanced 0.7% m/m in June and rose 24.4% y/y. The year to year breakdown by region is as follows: Northeast, 42.1%; West, 28.7%; South, 32.6%; Midwest, -1.9%.
The median sales price of a new single family home fell for the third month in the last four. The 1.6% decline to $231,300 followed a 7.4% drop during May.
| U.S. New Homes | June | May | Y/Y | 2005 | 2004 | 2003 |
|---|---|---|---|---|---|---|
| Total Sales (AR, 000's) | 1,131 | 1,166 | -11.1% | 1,280 | 1,201 | 1,091 |
| Median Price (NSA) | $231,300 | $235,000 | 2.3% | $234,208 | $217,817 | $191,383 |
by Tom Moeller July 27, 2006
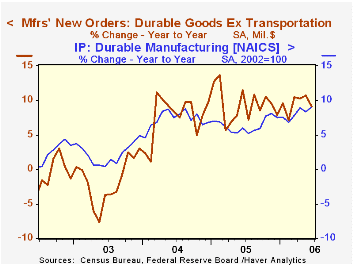
New orders for durable goods surged 3.1% in June after an upwardly revised 0.3% increase during the prior month. Consensus expectations had been for a somewhat lesser 2.0% jump.
An 8.8% rise in orders for nondefense aircraft & parts recovered not quite half of the 19.2% drop during May. Orders for defense aircraft jumped 12.9% (25.4% y/y).
Less the transportation sector altogether durable goods orders rose a firm 1.0%.
During the last ten years there has been a 69% correlation between the y/y change in durable goods orders and the change in output of durable goods.
Orders for nondefense capital goods recovered nearly all of the prior month's decline with a 1.3% gain. Less aircraft, orders rose a more moderate 0.4% during June but the prior month's increase was upwardly revised to 1.3%. During the last ten years there has been an 86% correlation between the y/y change in capital goods orders less aircraft and the y/y change in business fixed investment in equipment & software from the GDP accounts.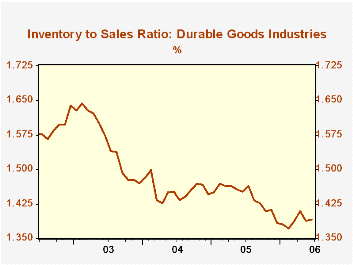
Higher orders for computers & electronic products led last month's strength with a 3.4% (0.8% y/y) spurt though computer orders alone rose just 1.5% (-2.3% y/y) after a downwardly revised 3.0% slip during May. Machinery orders slipped 0.3% (+10.5% y/y) after an upwardly revised 4.3% May increase. Orders for electrical equipment & appliances fell 1.0% (+15.0% y/y) but the prior month was very much upwardly revised to show a 2.7% increase.
Shipments of durable goods ticked up 0.1% (8.4% y/y) after an upwardly revised 3.0% May jump. Shipments less the transportation sector rose 0.4% (9.9% y/y) but the May jump was revised up to 2.1%. During the last ten years there has been an 82% correlation between the y/y change in durable goods shipments and the change in industrial production of durable goods.
Order backlogs gained 1.7% (19.4% y/y) again reflecting the strength in nondefense aircraft & parts (53.7% y/y). Unfilled orders less transportation gained another 1.3% (14.1% y/y).
Durable inventories rose 0.6% (4.9% y/y) after an upwardly revised 0.7% May rise. Less transportation inventories also rose 0.6% (5.4% y/y). The inventory to sales ratio outside of the transportation sector rose slightly.
| NAICS Classification | June | May | Y/Y | 2005 | 2004 | 2003 |
|---|---|---|---|---|---|---|
| Durable Goods Orders | 3.1% | 0.3% | 5.8% | 9.0% | 6.4% | -0.6% |
| Excluding Transportation | 1.0% | 1.5% | 9.1% | 9.4% | 7.6% | -1.7% |
| Nondefense Capital Goods | 1.3% | -1.9% | 3.5% | 21.4% | 5.6% | -3.4% |
| Excluding Aircraft | 0.4% | 1.3% | 7.7% | 12.3% | 2.8% | -2.0% |
by Tom Moeller July 27, 2006

A 7,000 worker decline last week in initial claims for unemployment insurance to 298,000 followed a little revised 129,000 slide during the prior period and pulled claims to the lowest level in six weeks. Consensus expectations had been for 310,000 claims.
During the last ten years there has been a (negative) 78% correlation between the level of initial claims and the m/m change in nonfarm payroll employment.
The four-week moving average of initial claims fell to 312,750 (-2.7% y/y).
Continuing claims for unemployment insurance fell 23,000 after a little revised 78,000 jump the prior week.
The insured rate of unemployment held steady at 1.9% where it has been since February.
The latest Beige Book from the Federal Reserve Board can be found here.
| Unemployment Insurance (000s) | 07/22/06 | 07/15/06 | Y/Y | 2005 | 2004 | 2003 |
|---|---|---|---|---|---|---|
| Initial Claims | 298 | 305 | -4.8% | 332 | 343 | 403 |
| Continuing Claims | -- | 2,475 | -5.2% | 2,663 | 2,923 | 3,530 |
by Tom Moeller July 27, 2006
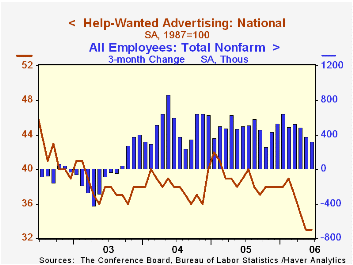
The Conference Board's Index of Help-Wanted Advertising remained at its forty five year low of 33 in June.
During the last ten years there has been a 57% correlation between the level of help-wanted advertising and the three month change in non-farm payrolls.
The proportion of labor markets with rising want-ad volume improved to 49% from the low 27% in May and an average 48% last year.
The Conference Board surveys help-wanted advertising volume in 51 major newspapers across the country every month.
The latest help wanted report from the Conference Board is available here.
Should the Decline in the Personal Saving Rate Be a Cause for Concern? from the federal Reserve Bank of Kansas City is available here.
| Conference Board | June | May | June '05 |
|---|---|---|---|
| National Help Wanted Index | 33 | 33 | 39 |
by Carol Stone July 27, 2006

Unemployment is falling in Europe. With the notable exception of the UK, unemployment rates are moving lower in most European countries. In May, the rates in Germany and France were both at their lowest since late 2002. Today, the three Scandinavian countries reported their latest rates. Denmark's labor force survey set records. In the 18-1/2 years of the Danish data, June saw the smallest number unemployed, 123,100, and the lowest unemployment rate, 4.5%, which was first reached in May. The number unemployed is down 23.7% from a year ago, before seasonal adjustment. (The other monthly figures are seasonally adjusted by Denmarks Statistiks.)
In Norway, the government's public employment service tallies its number of "registered" unemployed. These data are not seasonally adjusted, so they show a monthly increase for July. But the year-to-year comparisons are impressively favorable: the number unemployed is down more than 20,000 to 67,800 and the unemployment rate reached 2.8% from 3.7% in July 2005; this is the lowest July figure since 2001.
Sweden's data are a bit muddled, but they still show improvement. Statistics Sweden switched to the EU Harmonized structure of labor force data in April 2005, so data prior to that are not totally comparable with current results. Indeed, the graph shows a change in the pattern of the monthly evolution beginning at that time. However, we can still make a valid year-on-year comparison for June, and we see that the rate then was 6.5%, down from 7.0% in June 2005; the number unemployed is off 10.2%.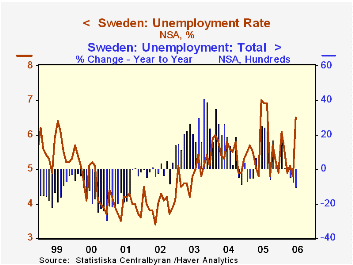
A similar story can be told for Finland, which published its June data on Tuesday. The current unemployment rate is 8.1%, the lowest rate for June since 1991.
In all these countries, these rates are falling because employment is rising. The release of data for employment lags or is compiled only quarterly, so comparisons aren't so clear, but what is clear is that through the latest available data, however counted, the number of jobs is increasing faster than the number of people seeking work. As we point out often to highlight the important distinction, unemployment can fall if jobs are tight and people give up seeking work altogether. But this is not the case now: jobs are up and joblessness is down.
| Thous. | July 2006 | June 2006 | May 2006 | Apr 2006 | Year Ago | 2005 | 2004 | 2003 |
|---|---|---|---|---|---|---|---|---|
| Denmark LFS*, Seas Adj | -- | 123.1 | 124.9 | 133.0 | 161.2 | 153.4 | 172.9 | 167.1 |
| Rate (%) | -- | 4.5 | 4.5 | 4.8 | 5.8 | 5.6 | 6.3 | 6.0 |
| Norway Reg.*, NSA | 67.8 | 62.3 | 60.6 | 66.6 | 89.3 | 76.2 | 84.9 | 91.7 |
| Rate (%) | 2.8 | 2.6 | 2.5 | 2.8 | 3.7 | 3.0 | 3.6 | 3.9 |
| Sweden LFS*, NSA | -- | 297.6 | 216.8 | 247.5 | 331.4 | 263.1 | 246.1 | 217.0 |
| Rate (%) | -- | 6.5 | 4.8 | 5.1 | 7.0 | 5.7 | 5.5 | 4.9 |
Tom Moeller
AuthorMore in Author Profile »Prior to joining Haver Analytics in 2000, Mr. Moeller worked as the Economist at Chancellor Capital Management from 1985 to 1999. There, he developed comprehensive economic forecasts and interpreted economic data for equity and fixed income portfolio managers. Also at Chancellor, Mr. Moeller worked as an equity analyst and was responsible for researching and rating companies in the economically sensitive automobile and housing industries for investment in Chancellor’s equity portfolio. Prior to joining Chancellor, Mr. Moeller was an Economist at Citibank from 1979 to 1984. He also analyzed pricing behavior in the metals industry for the Council on Wage and Price Stability in Washington, D.C. In 1999, Mr. Moeller received the award for most accurate forecast from the Forecasters' Club of New York. From 1990 to 1992 he was President of the New York Association for Business Economists. Mr. Moeller earned an M.B.A. in Finance from Fordham University, where he graduated in 1987. He holds a Bachelor of Arts in Economics from George Washington University.


