 Global| Oct 05 2020
NABE Projects Moderate Recovery in 2021 Following a Record Postwar Recession
by:Tom Moeller
|in:Economy in Brief
Summary
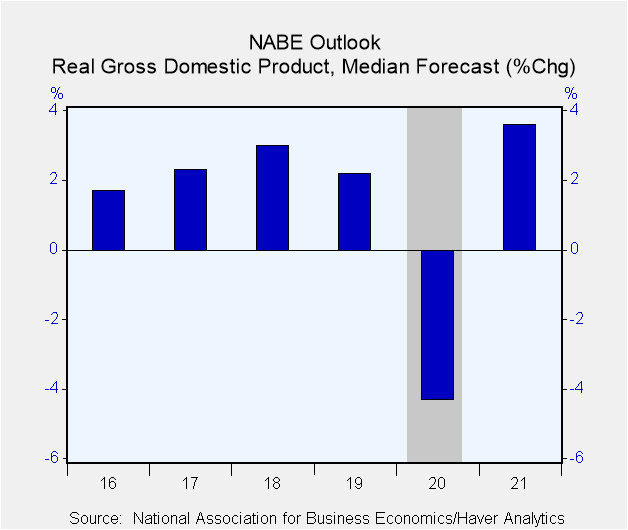
The National Association for Business Economics retained its projection for 3.6% growth in real GDP during 2021. This follows a record recession this year, with GDP expected to contract 4.3%, versus the prior forecast of a 5.9% [...]
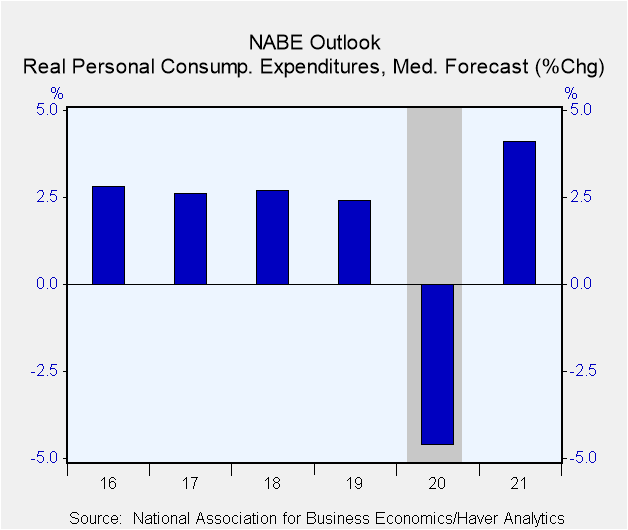
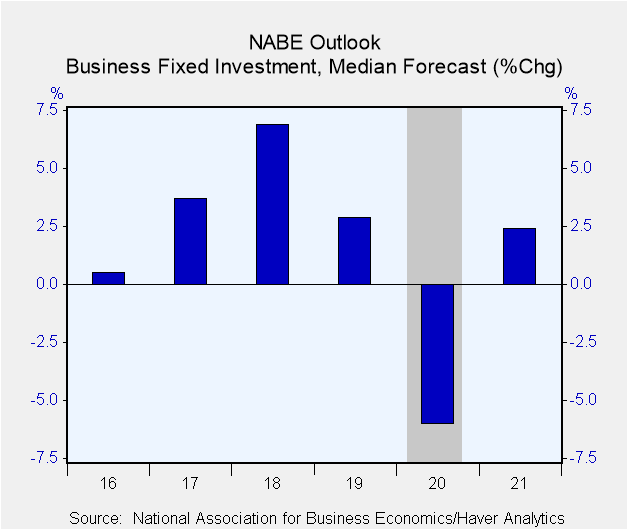
The National Association for Business Economics retained its projection for 3.6% growth in real GDP during 2021. This follows a record recession this year, with GDP expected to contract 4.3%, versus the prior forecast of a 5.9% decline. Quarterly growth is expected to average 3.6% next year, revised from 4.5%, after declining by 3.9% this year, revised from -5.6% this year. Personal consumption expenditures are forecast to improve 4.1% in 2021, revised from 4.4% after falling 4.6% in 2020, revised from -6.4%. Business fixed investment growth is expected to rise a little-revised 2.4% and recover some of this year's 6.0% fall, revised from -10.8%. Expected growth of 3.5% in residential investment next year, revised from 3.0% will follow 1.1% growth in 2020, revised from a 6.6% decline previously expected. Projected government spending growth is expected to slow to 0.9%, earlier expected to rise 1.3%, down sharply from gains during the prior two years. Deterioration in net exports is forecast to continue next year, but at a greater rate. Slow recoveries abroad are expected to limit the growth in U.S. exports to 5.0% next year versus a 6.6% rise in imports. In 2020, exports are projected to decline 13.5%, revised from -7.9% versus a forecasted drop of 12.3% in imports, revised from -11.4%. The expected rate of inventory investment is expected to pick up moderately next year after sharp decumulation in 2020.
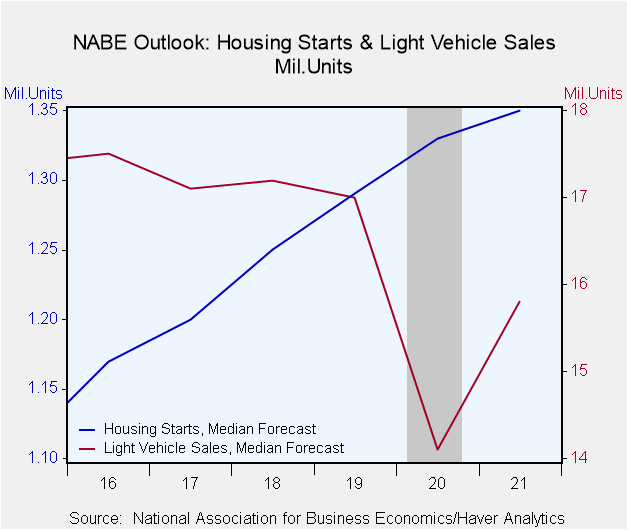
Housing starts are forecasted to rise next year to an average 1.35 million units next year, revised from 1.26 million and add to this year's rise to 1.33 million, earlier projected as 1.15 million. Expected light vehicle sales of 15.8 million units compares to 15.2 million projected earlier, after falling to 14.1 million this year, revised from 12.8 million. Sales should remain below the 2016 peak of 17.5 million. An average monthly gain in payroll employment of 350,000 next year (earlier projected as 497,000) recovers from an -670,000 decline this year, revised from -1.178 million. Expectations for the unemployment rate in 2021 place it at 6.8%, revised from 8.1%, following 8.4% this year, revised from 11.0%.
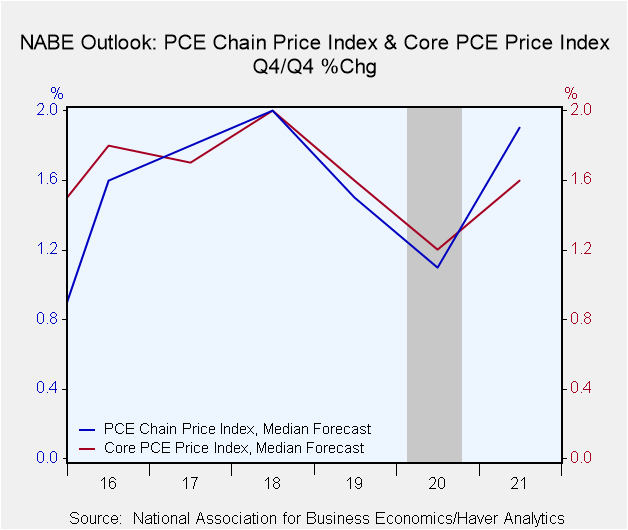
The Consumer Price Index is projected to rise 1.9% Q4/Q4 in 2021 from 1.1% this year. Price inflation next year, as measured by the PCE price index, is expected to rise to 1.9% Q4/Q4 from an estimate of 1.1% this year. The chain PCE price index excluding food & energy should rise 1.6% next year (Q4/Q4), from 1.2% expected this year. The cost of crude oil is expected to average an increased $47 per barrel at the end of 2021, rising slightly versus a projected $41 at the end of 2020.
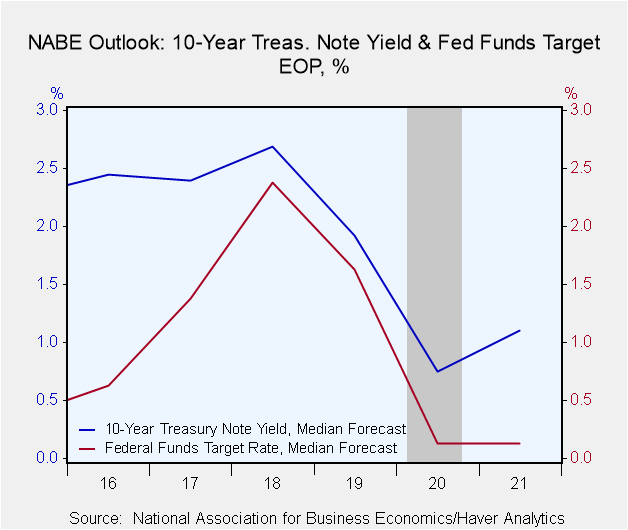
The forecasted 1.1% interest rate on a ten-year Treasury note at yearend 2021 was reduced from 1.2% and compares to a little-revised 0.75% rate at the end of 2020. The Federal funds rate is projected to be steady around 0.125% until the end of next year. After-tax corporate profits should rise 8.5% next year, reduced from 11.0%, after an 11.0% decline this year, revised from a slight increase. The expected Federal government budget deficit should surge to $3.523 trillion in FY20, then ease to $1.981 trillion next year.
The figures from the latest NABE report can be found in Haver's SURVEYS database.
| National Association For Business Economics | 2021 | 2020 | 2019 | 2018 | 2017 |
|---|---|---|---|---|---|
| Real GDP (% Chg. SAAR) | 3.6 | -4.3 | 2.2 | 3.0 | 2.3 |
| Personal Consumption Expenditures | 4.1 | -4.6 | 2.6 | 2.7 | 2.6 |
| Business Fixed Investment | 2.4 | -6.0 | 2.9 | 6.9 | 3.7 |
| Residential Investment | 3.5 | 1.1 | -1.7 | -0.6 | 4.0 |
| Gov't Consumption & Gross Investment | 0.9 | 1.8 | 2.3 | 1.8 | 0.9 |
| Change in Real Business Inventories (Bil. $) | 46.0 | -118.0 | 48.5 | 53.4 | 15.8 |
| Net Exports (Bil. $) | -881.0 | -811.0 | -917.6 | -877.7 | -816.8 |
| Housing Starts (Mil. Units) | 1.35 | 1.33 | 1.29 | 1.25 | 1.20 |
| Light Vehicle Sales (Mil. Units) | 15.8 | 14.1 | 17.0 | 17.2 | 17.1 |
| Payroll Employment Average Monthly Change (000s) | 350 | -670 | 178 | 193 | 176 |
| Civilian Unemployment Rate (%) | 6.8 | 8.4 | 3.7 | 3.9 | 4.3 |
| Consumer Price Index (Q4/Q4 %) | 1.9 | 1.1 | 2.0 | 2.2 | 2.1 |
| Chain Price Index for PCE (Q4/Q4 %) | 1.9 | 1.1 | 1.5 | 2.0 | 1.8 |
| Chain Price Index excl. Food & Energy (Q4/Q4 %) | 1.6 | 1.2 | 1.6 | 2.0 | 1.7 |
| Fed Funds Rate (%, Year-End) | 0.125 | 0.125 | 1.625 | 2.375 | 1.375 |
| 10-Year Treasury Note (%, Year-End) | 1.10 | 0.75 | 1.92 | 2.69 | 2.40 |
Tom Moeller
AuthorMore in Author Profile »Prior to joining Haver Analytics in 2000, Mr. Moeller worked as the Economist at Chancellor Capital Management from 1985 to 1999. There, he developed comprehensive economic forecasts and interpreted economic data for equity and fixed income portfolio managers. Also at Chancellor, Mr. Moeller worked as an equity analyst and was responsible for researching and rating companies in the economically sensitive automobile and housing industries for investment in Chancellor’s equity portfolio. Prior to joining Chancellor, Mr. Moeller was an Economist at Citibank from 1979 to 1984. He also analyzed pricing behavior in the metals industry for the Council on Wage and Price Stability in Washington, D.C. In 1999, Mr. Moeller received the award for most accurate forecast from the Forecasters' Club of New York. From 1990 to 1992 he was President of the New York Association for Business Economists. Mr. Moeller earned an M.B.A. in Finance from Fordham University, where he graduated in 1987. He holds a Bachelor of Arts in Economics from George Washington University.


