 Global| Feb 12 2003
Mortgage Applications Still Firm
by:Tom Moeller
|in:Economy in Brief
Summary
The index of mortgage applications, compiled by the Mortgage Bankers Association, fell last week for the fourth week in the last five. Nevertheless, applications remained up 22.9% so far this year versus December and were up 86.2% [...]
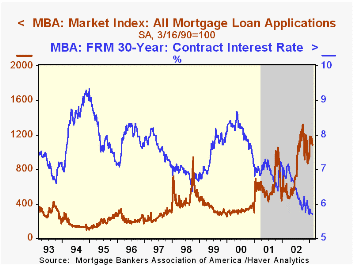
The index of mortgage applications, compiled by the Mortgage Bankers Association, fell last week for the fourth week in the last five. Nevertheless, applications remained up 22.9% so far this year versus December and were up 86.2% y/y.
Mortgage applications to refinance fell for the fourth week in five but remained up 33.9% so far in 2003 versus December. Applications to refinance were well more than double last year's level.
Mortgage applications for home purchase also fell but much harder than did applications to refinance. So far this year, purchase applications were barely higher than December (+0.4%) and were up 4.5% y/y.
Interest rates on conventional 30 Year mortgages fell to 5.68%.
| MBA Mortgage Applications (3/16/90=100) | 2/07/03 | 1/31/03 | 2002 | 2001 | 2000 |
|---|---|---|---|---|---|
| Total Market Index | 1,083.1 | 1,141.4 | 799.7 | 625.6 | 322.7 |
| Purchase | 328.8 | 371.1 | 354.7 | 304.9 | 302.7 |
| Refinancing | 5,470.3 | 5,621.6 | 3,388.0 | 2,491.0 | 438.8 |
by Tom Moeller February 12, 2003
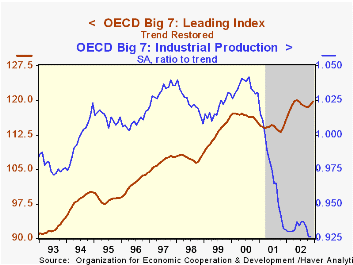
The OECD Index of Leading Indicators rose in December for the third consecutive month. Leaders in the Major Seven countries rose but gains were largely limited to the US.
Leading indicators in the European Union have barely budged since the Summer. Japan leaders did manage modest gains in October and November. However, through December Japan's leaders rose just 1.6% y/y and not at all since April.
Despite these scattered signs of improvement, economic slack remains great in the Major Seven OECD countries. Industrial production in the Big Seven was roughly 7.5% below trend as of December. The shortfall in the EU was 4.7% but production in the US was 11.9% below trend.
| OECD Main Economic Indicators | Dec | Nov | Y/Y | 2002 | 2001 | 2000 |
|---|---|---|---|---|---|---|
| OECD Total - Leading Index (Trend Restored) | 121.3 | 120.6 | 4.0% | 4.1% | -2.1% | 3.7% |
| 3Q02 | 2Q02 | |||||
| OECD Total - GDP (Mil. 95 US$, SAAR) | 3.1% | 2.2% | 2.4% | n.a. | 0.8% | 3.8% |
| Major Seven - GDP (Mil. 95 US$, SAAR) | 3.1% | 1.8% | 2.2% | n.a. | 0.7% | 3.4% |
| European Union - GDP (Mil. 95 US$, SAAR) | 1.7% | 1.7% | 1.1% | n.a. | 1.6% | 3.6% |
| Germany - GDP (Bil. 95 Euros, SAAR) | 1.1% | 0.6% | 0.4% | n.a. | 0.7% | 3.1% |
| United Kingdom - GDP (Mil. 95 Pounds, SAAR) | 3.8% | 2.6% | 2.1% | n.a. | 2.0% | 3.1% |
| Japan - GDP (Bil. 95 Yen, SAAR) | 3.2% | 3.8% | 1.3% | n.a. | 0.3% | 2.4% |

Tom Moeller
AuthorMore in Author Profile »Prior to joining Haver Analytics in 2000, Mr. Moeller worked as the Economist at Chancellor Capital Management from 1985 to 1999. There, he developed comprehensive economic forecasts and interpreted economic data for equity and fixed income portfolio managers. Also at Chancellor, Mr. Moeller worked as an equity analyst and was responsible for researching and rating companies in the economically sensitive automobile and housing industries for investment in Chancellor’s equity portfolio. Prior to joining Chancellor, Mr. Moeller was an Economist at Citibank from 1979 to 1984. He also analyzed pricing behavior in the metals industry for the Council on Wage and Price Stability in Washington, D.C. In 1999, Mr. Moeller received the award for most accurate forecast from the Forecasters' Club of New York. From 1990 to 1992 he was President of the New York Association for Business Economists. Mr. Moeller earned an M.B.A. in Finance from Fordham University, where he graduated in 1987. He holds a Bachelor of Arts in Economics from George Washington University.
More Economy in Brief


