 Global| Jun 07 2006
Mortgage Applications Fell Further
by:Tom Moeller
|in:Economy in Brief
Summary
The total number of mortgage applications fell 1.4% last week and lowered the level in early June 4.8% below the May average which fell 2.2% from April. Purchase applications were stable w/w but because of earlier declines the opening [...]
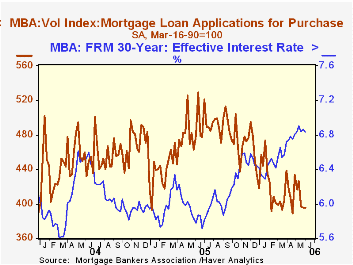
The total number of mortgage applications fell 1.4% last week and lowered the level in early June 4.8% below the May average which fell 2.2% from April.
Purchase applications were stable w/w but because of earlier declines the opening level in June was 3.2% below the May average. It was down 0.8% versus April.
During the last ten years there has been a negative 80% correlation between the interest rate level on 30-year financing and purchase applications while during those years there has been a 54% correlation between the y/y change in purchase applications and the change in new plus existing single family home sales.
Applications to refinance dropped 3.8% on top of the prior week's 4.8% skid. Refis opened June 7.5% below the May average which fell 4.1% from April.
The effective interest rate on a conventional 30-year mortgage dipped to 6.83% from 6.86% the prior week. Rates began June about even with the May average of 6.86% but were up sharply from the 5.81% low last June. The rate on 15-year financing was stable for the third week at 6.52%. Interest rates on 15 and 30 year mortgages are closely correlated (>90%) with the rate on 10 year Treasury securities and during the last ten years there has been a (negative) 82% correlation between purchase applications and the effective rate on a 30-Year mortgage.
The Mortgage Bankers Association surveys between 20 to 35 of the top lenders in the U.S. housing industry to derive its refinance, purchase and market indexes. The weekly survey accounts for more than 40% of all applications processed each week by mortgage lenders. Visit the Mortgage Bankers Association site here.
Challenges of Conducting Effective Risk Management in Community Banks, yesterday's speech by Fed Governor Susan Schmidt Bies, is available here.
| MBA Mortgage Applications (3/16/90=100) | 06/02/06 | 05/26/06 | Y/Y | 2005 | 2004 | 2003 |
|---|---|---|---|---|---|---|
| Total Market Index | 534.4 | 541.9 | -29.3% | 708.6 | 735.1 | 1,067.9 |
| Purchase | 395.6 | 395.5 | -17.5% | 470.9 | 454.5 | 395.1 |
| Refinancing | 1,356.0 | 1,409.0 | -42.6% | 2,092.3 | 2,366.8 | 4,981.8 |
by Tom Moeller June 7, 2006
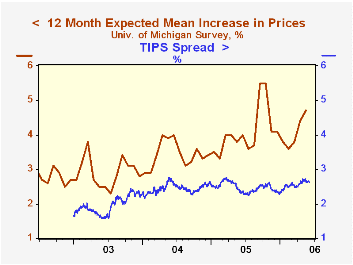
Inflation expectations were piqued this week by Fed Chairman Bernanke's comments that the three-month and six-month core PCE inflation figures at 3.0% and 2.3% were "unwelcome developments."
As a result, the yield on the inflation-protected Treasury note rose to 2.44% from 2.40% on Monday but the yield on the nominal security fell to 5.01%. The so called TIPS spread narrowed to 2.57% from 2.62% on Monday.
Bernanke's comments implied that more inflation pressure existed than had been perceived but that the Fed would combat those pressures more forcefully than previously expected. 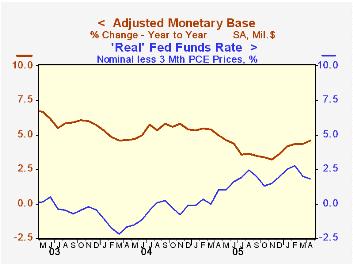
The rise in the TIPS spread this year has followed a rise in 12 month inflation expectations to 4.7% in May from 3.8% in January, as surveyed by the University of Michigan.
Inflation Expectations: How the Market Speaks from the Federal Reserve Bank of San Francisco is available here.
How much work the Fed still must do to contain inflation is the $64,000 question. Already it has lifted short term interest rates by 400 basis points to 5.0%. More action might be suggested, however, by a recent pickup in the y/y growth of the monetary base (liquidity) to 4.6%. It had slowed previously to 3.2% from 5.8% late in 2004. In addition, the "real" Fed funds rate fell as the three month growth in "core" PCE prices tripled to 3.0% in May versus last August.
The Shadow Open Market Committee can be visited here and its Policy Statement from May, 2005 can be found here.
| Treasury Inflation Indexed Securities | 06/06/06 | 06/05/06 | 12/31/05 |
|---|---|---|---|
| 10 Yr. Treas. Note at Constant Maturity Due 1/15/16 | 2.44% | 2.40% | 2.06% |
by Carol Stone June 7, 2006
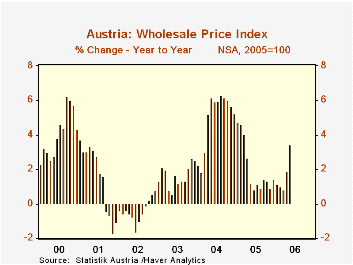
Inflation is becoming a hot topic once again. For instance, Austria's wholesale prices for May, which were released today, jumped 3.4% year-on-year, their largest increase since March 2005. Fuel has the main upward thrust, but other items are seeing bigger price advances as well.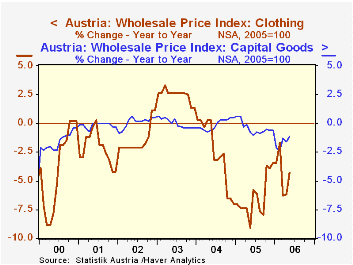
In the table below, we see prices of food, consumer goods and "intermediary" goods rising more rapidly. Some individual items include pharmaceuticals, household appliances, nonferrous metals and iron and steel. This last had been falling steeply for just over a year, but suddenly in May, it has a year-to-year increase; at 0.9%, the rise is not large, but marks a turn from a declining trend. World commodities prices in addition to oil have been booming, and those advances look to be working their way into costs of products in even such a medium-size economy as Austria.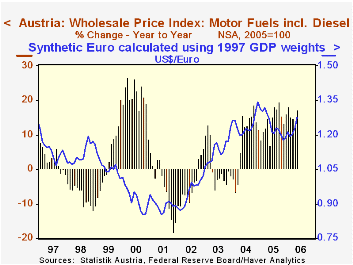
A couple of exceptions stand out, however. Clothing prices continue deep in negative territory. This appears to be something of an exception as well, compared with other countries. Clothing prices have been declining at retail in most countries, but their producer prices have been increasing. Austria's products, though, seem to be getting cheaper. Capital goods prices have also been weakening, sustaining a trend in Austria that appears to have ended in most other countries, apart from computers and telecommunications equipment. It will be interesting to see in coming months if the Austrians can keep their finished equipment prices down in the face of the price increases in metals and other components.
Finally, petroleum products are becoming more expensive in Austria, just as everywhere else. At the same time, this force may be muted somewhat by the recent strengthening of the euro. In the third graph, we see that in 2000 the weakening euro was associated with very large increases in fuel prices in Austria. The subsequent strengthening of the currency accompanied relative weakening of energy prices. A rough negative relationship is evident, although the numerical correlation is low (around 18%). So we could then watch for relatively more moderate increases in energy costs, which of course, are priced in dollars in world markets.
| Austria: Wholesale Price Indexes, Yr/Yr % Changes | May 2006 | Apr 2005 | Mar 2005 | December/December|||
|---|---|---|---|---|---|---|
| 2005 | 2004 | 2003 | ||||
| Total WPI | 3.4 | 1.9 | 0.8 | 1.4 | 5.2 | 2.5 |
| Consumer Goods | 1.5 | 1.7 | 0.2 | 3.9 | 0.2 | 2.3 |
| Intermediary Goods | 7.0 | 3.6 | 1.9 | -0.4 | 12.6 | 3.9 |
| Capital Goods | -1.1 | -2.6 | -1.3 | -0.6 | 0.5 | -0.4 |
| "Other" Food* | 1.1 | 0.8 | 0.3 | 0.3 | 1.1 | 0.6 |
| Clothing | -4.3 | -6.2 | -6.3 | -3.4 | -7.0 | 1.4 |
| Motor Fuel | 17.3 | 12.9 | 14.6 | 16.0 | 11.5 | -1.9 |
| Machine Tools | 0.7 | 0.1 | 0.8 | 1.4 | 1.4 | 0.5 |

Tom Moeller
AuthorMore in Author Profile »Prior to joining Haver Analytics in 2000, Mr. Moeller worked as the Economist at Chancellor Capital Management from 1985 to 1999. There, he developed comprehensive economic forecasts and interpreted economic data for equity and fixed income portfolio managers. Also at Chancellor, Mr. Moeller worked as an equity analyst and was responsible for researching and rating companies in the economically sensitive automobile and housing industries for investment in Chancellor’s equity portfolio. Prior to joining Chancellor, Mr. Moeller was an Economist at Citibank from 1979 to 1984. He also analyzed pricing behavior in the metals industry for the Council on Wage and Price Stability in Washington, D.C. In 1999, Mr. Moeller received the award for most accurate forecast from the Forecasters' Club of New York. From 1990 to 1992 he was President of the New York Association for Business Economists. Mr. Moeller earned an M.B.A. in Finance from Fordham University, where he graduated in 1987. He holds a Bachelor of Arts in Economics from George Washington University.
More Economy in Brief


