Global| Feb 17 2005
Mexican GDP for 2004 Shows Biggest Gain since 2000
Summary
The Mexican economy had its strongest performance since 2000, shown in GDP data reported late yesterday by the National Institute of Statistics, Geography and Information. Real GDP (in basic prices*) grew 1.7% in Q4, putting four- [...]
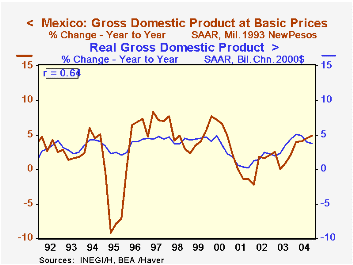
The Mexican economy had its strongest performance since 2000, shown in GDP data reported late yesterday by the National Institute of Statistics, Geography and Information. Real GDP (in basic prices*) grew 1.7% in Q4, putting four-quarter growth at 4.9% and the total for 2004 at 4.4%. This was the largest increase since 6.6% in 2000.
In Q4, manufacturing and trade and tourism led the way. Manufacturing's actual growth was moderate, 0.5%, but that represented a turnaround from a decline of 0.2% in Q3. Wholesale and retail trade and restaurants and hotels together grew 4.0% in Q4, its strongest quarterly gain since Q1 2000, that is, nearly five years. Transportation and communication output rose 1.5% in the last quarter, somewhat less than Q3's 2.5%, but the four-quarter pace was a steamy 9.9%.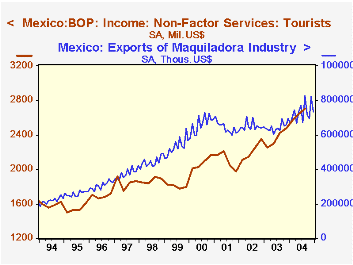
In recent years, the fortunes of the Mexican economy have been heavily tied to those of the United States. NAFTA is probably a contributor to that, as the correlation of the two countries' GDP trends changed toward becoming much more parallel in the early 1990s when NAFTA was enacted. In the second graph here, the linkage is illustrated by the path of exports in maquiladora industries. Receipts from tourism were also up sharply during the first three quarters of 2004. These relationships with Mexican GDP growth are not exact, but they do suggest that Mexico's economy has different and less tense reactions to exchange rates and the price of oil than other countries described here in the last few days.
Mexican data are presented in Haver's EMERGELA database. As seen in the graph, the collection includes trade through the maquiladora mechanism; employment in maquiladoras is also contained in the database.
| Mexico GDP (1993 New Pesos, % Change) |
Q4 2004 | Q3 2004 | Year/Year | 2004 | 2003 | 2002 |
|---|---|---|---|---|---|---|
| Real GDP* | 1.7 | 0.9 | 4.9 | 4.4 | 1.4 | 0.8 |
| Manufacturing | 0.5 | -0.2 | 3.6 | 3.8 | -1.3 | -0.7 |
| Trade & Tourism | 4.0 | 2.1 | 7.0 | 4.9 | 1.6 | 0.0 |
| Transportation & Communication | 1.5 | 2.5 | 9.9 | 9.7 | 5.0 | 1.8 |
Carol Stone, CBE
AuthorMore in Author Profile »Carol Stone, CBE came to Haver Analytics in 2003 following more than 35 years as a financial market economist at major Wall Street financial institutions, most especially Merrill Lynch and Nomura Securities. She had broad experience in analysis and forecasting of flow-of-funds accounts, the federal budget and Federal Reserve operations. At Nomura Securities, among other duties, she developed various indicator forecasting tools and edited a daily global publication produced in London and New York for readers in Tokyo. At Haver Analytics, Carol was a member of the Research Department, aiding database managers with research and documentation efforts, as well as posting commentary on select economic reports. In addition, she conducted Ways-of-the-World, a blog on economic issues for an Episcopal-Church-affiliated website, The Geranium Farm. During her career, Carol served as an officer of the Money Marketeers and the Downtown Economists Club. She had a PhD from NYU's Stern School of Business. She lived in Brooklyn, New York, and had a weekend home on Long Island.
More Economy in Brief