 Global| Jan 24 2008
Mass Layoffs Higher Still
by:Tom Moeller
|in:Economy in Brief
Summary
During December the number of mass layoff events rose another 7.8%, according to BLS data, and that countered a 1.3% November decline.These specific layoff incidents are called "mass layoffs" because they involve 50 or more initial [...]
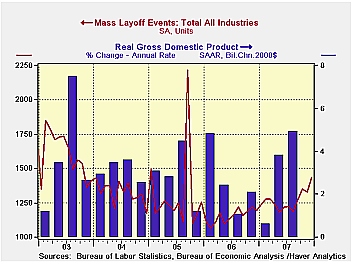
During December the number of mass layoff events rose another 7.8%, according to BLS data, and that countered a 1.3% November decline.These specific layoff incidents are called "mass layoffs" because they involve 50 or more initial claims for unemployment insurance.
The December gain left the number of mass layoff events, up 20% since December '06, at the highest level since January of 2005. For all of last year, mass layoff events rose 10.1% from 2006, reversing all of that year's 11.7% decline.
The December increase was accompanied by a 1.5% m/m gain in
initial claims for unemployment insurance. Versus December of 2006
claims rose 8.2% versus the prior December. For the full year the
number of claims rose 6.7%. That offset about half of the 2006 decline.
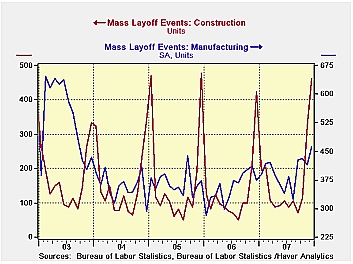
For all of last year the rise in mass layoff events was led by a 26.3% jump in the construction industry which offset all of 21.7% decline during 2006. Events in the factory sector rose 8.5% after an 11.5% '06 decline as layoffs in transportation industries rose 15.5%, 22.7% in furniture and 22.3% in primary metals.
Mass layoff events amongst industries in the service sector were scattered with a 64.5% rise in finance & insurance, a 5.8% gain retail trade and a 19.3% advance in the professional scientific & technical businesses. In the government sector mass layoff events rose but only by 2.5%. That offset just a piece of an 18.5% decline during 2006. In the arts & entertainment industries events fell 2.0% which followed a 16.4% decline during the prior year.
These mass layoff data are contained in Haver's flagship database, USECON. Data are also available by Census regions, divisions and states, including some industry detail for each. These are all carried in the REGIONAL database.
How Useful is Okun's Law? which examines the relationship between GDP growth and unemployment, from the Federal Reserve Bank of Kansas City, can be found here.
| Mass Layoffs, SA | December | November | December ‘06 | Monthly Averages | ||
|---|---|---|---|---|---|---|
| 2007 | 2006 | 2005 | ||||
| Number of Events | 1,433 | 1,329 | 1,1940 | 1,269 | 1,152 | 1,305 |
| Initial Claims (Number Persons) |
127,897 | 118,414 | 123,558 | 129,808 | 121,609 | 143,402 |
by Robert Brusca January 25, 2008
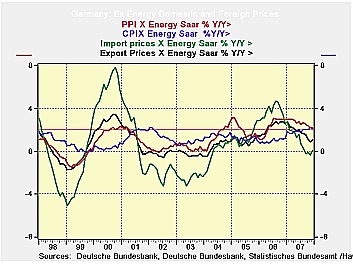
German import prices surged by 0.5%. But strip out energy and
the rise is reduced to 0.1%; export prices excluding energy are flat,
too. Year-over-year import prices excluding energy are up by 0.1%;
export prices on that basis are up by 1.0%. The CPI ex energy is close
to the ECB 2% ceiling at 2.1% and the PPI ex-energy is up by 2.2%, both
over 12 months. Despite some spiking inflation early in the year and in
mid-2006 even for ex energy prices inflation has settled down in the
Germany ex-energy economy.
Still, the ECB is not an Ex-energy or Core inflation targeting
central bank. The ECB speaks in terms of headline inflation and in
Germany that is still hot; in the Euro area it is hotter still. The ECB
is also wary of what has been excessive growth in money and in credit.
But the ex energy price indices are a strong indication that true
inflation is not brewing in the monetary union. Energy prices have been
boosted strongly but those effects have not spread. What the ECB and
the Bundesbank are now worried about is contagion via wage deals that
are being negotiated and where workers seem to be thinking in terms of
headline inflation, which is the rate that most affects them. So wage
restraint is the ECB’s main reason to keep policy tight, and to keep
warm the rhetoric about needing to cool inflation.
| German International and Domestic Inflation Trends | |||||||
|---|---|---|---|---|---|---|---|
| % m/m | % Saar | ||||||
| SA | Dec-07 | Nov-07 | Oct-07 | 3-Mo | 6-Mo | 12-Mo | Yr-Ago |
| Export Prices | 0.1% | 0.2% | 0.1% | 1.5% | 0.6% | 1.3% | 2.4% |
| Import Prices | 0.5% | 1.1% | 1.0% | 10.8% | 3.9% | 3.8% | 2.2% |
| NSA | |||||||
| Exports excl Petrol | 0.0% | -0.1% | 0.0% | -0.4% | 0.0% | 1.0% | 2.5% |
| Imports excl Petrol | 0.1% | -0.4% | 0.4% | 0.4% | -1.2% | 0.1% | 2.7% |
| Memo: SA | |||||||
| CPI | -0.3% | 0.6% | 0.3% | 2.5% | 2.5% | 2.7% | 1.4% |
| CPI excl energy | 0.1% | 0.2% | 0.3% | 2.2% | 2.4% | 2.1% | 1.2% |
| PPI | 0.0% | 0.9% | 0.3% | 5.1% | 2.9% | 2.5% | 4.3% |
| PPI excl energy | 0.1% | 0.1% | 0.2% | 1.4% | 1.6% | 2.2% | 2.9% |
| Oil on Import Prices | 0.4% | 1.5% | 0.6% | 10.4% | 5.1% | 3.7% | -0.5% |
by Robert Brusca January 25, 2008

France’s business climate indicator is steady this month at
109; over 12 months the index is rising at a steady 2.8% annual rate.
Still there is no sign of advance in the index since March of 2007 when
it has hovered between 108 and 111, which is the recent cycle high. At
109 the index is well above its average of 100. Still its components
are showing more signs of softening. Placed in their respective ranges
since 1990 the overall index stands in the top 30% in the seventy
second percentile. The recent trend for industry at a raw reading of -5
is at the 52nd percentile level of range. The likely trend at 47 is in
the 83rd percentile of its range or in the top 20% of it. French
industrialists think the trend is going to improve significantly.
Orders and demand stand in the top 30% of their range while foreign
orders and demand are in the top third of their range. The likely price
trend for sales is a borderline top 25% reading. The recent trend
readings have deteriorated since October. Even so the likely trend
reading has improved. The assessment of demand, both foreign and total,
has eased but sporadically. On balance, for such a strong-seeming
reading on the overall index, French industry has had some concerns
lately. The main prop to the index is apparently expectations that
conditions are about to improve. It’s hard to tell what that might be
based on, given all the challenges to markets and policy. But it is
there, embedded in the survey responses, nonetheless.
| INSEE Industry Survey | ||||||||||
|---|---|---|---|---|---|---|---|---|---|---|
| Since Jan 1990 | Since Jan 1990 | |||||||||
| Jan-08 | Dec-07 | Nov-07 | Oct-07 | %tile | Rank | Max | Min | Range | Mean | |
| Climate | 109 | 109 | 110 | 108 | 72.0 | 48 | 123 | 73 | 50 | 101 |
| Production | ||||||||||
| Recent Trend | -5 | 4 | 3 | 10 | 52.0 | 109 | 44 | -58 | 102 | -5 |
| Likely trend | 47 | 44 | 43 | 34 | 83.3 | 4 | 63 | -33 | 96 | 8 |
| Orders/Demand | ||||||||||
| Orders & Demand | 1 | 1 | 4 | -1 | 72.4 | 41 | 25 | -62 | 87 | -14 |
| Foreign Orders & Demand | 1 | 6 | 4 | 3 | 66.3 | 68 | 31 | -58 | 89 | -10 |
| Prices | ||||||||||
| Likely Sales Prices Trend | 12 | 12 | 10 | 9 | 74.5 | 24 | 24 | -23 | 47 | 1 |

Tom Moeller
AuthorMore in Author Profile »Prior to joining Haver Analytics in 2000, Mr. Moeller worked as the Economist at Chancellor Capital Management from 1985 to 1999. There, he developed comprehensive economic forecasts and interpreted economic data for equity and fixed income portfolio managers. Also at Chancellor, Mr. Moeller worked as an equity analyst and was responsible for researching and rating companies in the economically sensitive automobile and housing industries for investment in Chancellor’s equity portfolio. Prior to joining Chancellor, Mr. Moeller was an Economist at Citibank from 1979 to 1984. He also analyzed pricing behavior in the metals industry for the Council on Wage and Price Stability in Washington, D.C. In 1999, Mr. Moeller received the award for most accurate forecast from the Forecasters' Club of New York. From 1990 to 1992 he was President of the New York Association for Business Economists. Mr. Moeller earned an M.B.A. in Finance from Fordham University, where he graduated in 1987. He holds a Bachelor of Arts in Economics from George Washington University.
More Economy in Brief


