 Global| Oct 01 2012
Manufacturing PMIs Give Little Hope
Summary
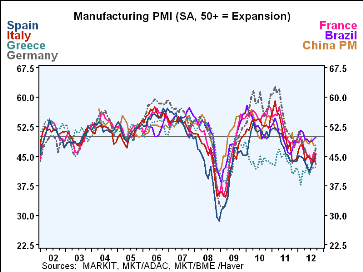
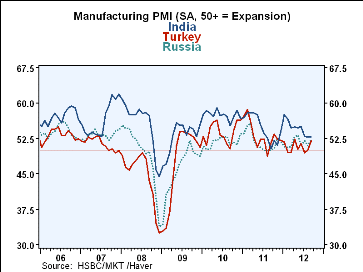
The overall September Purchasing Managers Survey for manufacturing improved slightly from 48.07 in August to 48.96 in September. (Values above 50 represent expansion while values under 50 represent contraction.) Most countries [...]
The overall September Purchasing Managers Survey for manufacturing improved slightly from 48.07 in August to 48.96 in September. (Values above 50 represent expansion while values under 50 represent contraction.) Most countries experienced an increase in their PMIs in September, but most remained below the 50 mark, notably China, Brazil, the Euro Area as a whole and France, Germany, Spain, Greece and Italy in particular. These are shown in the first chart. Among those countries whose PMIs were above the 50 mark were India, Russia and Turkey as shown in the second chart. The PMI in the US also increased in September, but only marginally, from 51.03 in August to 51.12in September. The PMI in the other major economy, the UK, declined 1.14 points from 49.51 in August to 48.37 in September.
The manufacturing PMIs are good indicators of future trends in Industrial Production. The September data suggest there are likely to be more declines in industrial production than increases in the coming months and that the global economy is not yet out of woods.
More Economy in Brief
 Global| Feb 05 2026
Charts of the Week: Balanced Policy, Resilient Data and AI Narratives
by:Andrew Cates


