 Global| Jul 17 2007
Lower Energy Prices Ease U.S. PPI; Core Prices Firm
by:Tom Moeller
|in:Economy in Brief
Summary
The producer price index for finished goods fell 0.2% last month following its 0.9% rise in May. The decline compared to Consensus forecasts for a 0.1% increase and it was the first decline since January. Food prices fell 0.8% (+6.3% [...]
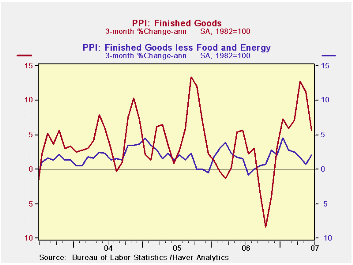
The producer price index for finished goods fell 0.2% last month following its 0.9% rise in May. The decline compared to Consensus forecasts for a 0.1% increase and it was the first decline since January.
Food prices fell 0.8% (+6.3% y/y) after May's 0.2% dip.
Energy prices, in addition, declined a sharp 1.1% (+4.3% y/y) as gasoline prices fell 3.9% (+3.8% y/y).Fuel oil dipped 0.5% (-0.6% y/y/y) but natural gas prices increased a hefty 2.6% (6.8% y/y), the firmest y/y increase since June 2006.
The core finished goods PPI increased 0.3%, bit more than the 0.2% May rise but the last two increases followed two months of unchanged readings during March and April. Consensus estimates were for a 0.2% increase in June.
Finished consumer goods prices less food & energy rose 0.3% (1.7% y/y) as passenger car prices rose 0.9% (-1.8% y/y) after an unchanged reading during May.
Capital equipment prices increased 0.2% (1.8% y/y) after unchanged prices during the prior two months. Most of the June increase was due to a 1.0% (0.8% y/y) in prices of light motor trucks.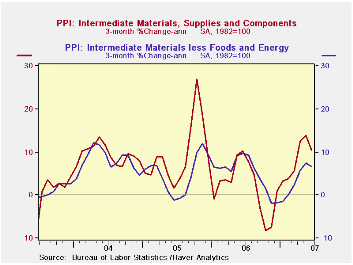
Intermediate goods prices added 0.5% to the firm 1.1% increase during May.Intermediate food prices rose a large 1.6% (15.3% y/y), suggesting future strength in finished food prices. The index excluding food & energy prices rose the same 0.4% (2.7% y/y) as it did during May.
The crude materials PPI rose 0.3% (14.9% y/y), as energy prices rose 0.6% (8.5% y/y) and food prices rose 0.5% (27.1% y/y). The core crude materials PPI fell 0.2% (10.2% y/y) as copper scrap prices fell 6.6% NSA (+9.6% y/y) and aluminum scrap prices fell 2.3% NSA (-3.3% y/y).
| Producer Price Index | June | May | Y/Y | 2006 | 2005 | 2004 |
|---|---|---|---|---|---|---|
| Finished Goods | -0.2 | 0.9% | 3.2% | 2.9% | 4.9% | 3.6% |
| Core | 0.3 | 0.2% | 1.8% | 1.4% | 2.4% | 1.5% |
| Intermediate Goods | 0.5% | 1.1% | 3.4% | 6.4% | 8.0% | 6.6% |
| Core | 0.4% | 0.4% | 2.7% | 6.0% | 5.5% | 5.7% |
| Crude Goods | 0.3% | 2.0% | 14.9% | 1.4% | 14.6% | 17.5% |
| Core | -0.2% | 0.1% | 10.1% | 20.9% | 4.9% | 26.5% |
by Tom Moeller Industrial Production Rebounded In June July 17, 2007
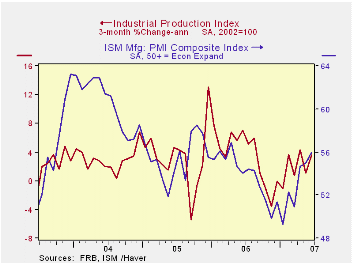
For June, industrial production rebounded 0.5% after a revised 0.1% decline during the prior month. The magnitude of the rebound matched Consensus expectations.
Little of the figures were distorted by movement in the utility or in the mining categories. As a result, factory output rose 0.5% after a revised no change in May. 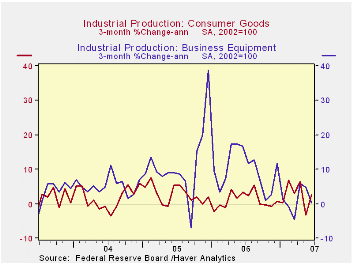
Consumer goods output surged 0.7% (1.6% y/y) led by a 2.5% (-1.7% y/y) pop in motor vehicle output. Production of computers & electronics also rose a strong 1.1% (9.3% y/y) while output of furniture rose a tentative 1.2% (-4.1% y/y). To the downside was production of apparel by 2.4% (-3.4% y/y.
Production of business equipment was unchanged for the second consecutive month (3.4% y/y), held back by a 0.6% decline in output of industrial & other equipment. Information processing & related equipment rose 0.4% (5.7% y/y.
Capacity utilization rose to 81.7%from 81.4% in May as capacity rose 0.1% (2.1% y/y for the fifth strait month.
How Accurate Are Real-Time Estimates of Output Trends and Gaps? from the Federal Reserve Bank of Richmond can be found here.
| INDUSTRIAL PRODUCTION (SA) | June | May | Y/Y | 2006 | 2005 | 2004 |
|---|---|---|---|---|---|---|
| Total | 0.5% | -0.1% | 1.3% | 4.0% | 3.2% | 2.5% |
| Manufacturing | 0.5% | 0.0% | 1.6% | 4.7% | 3.9% | 2.9% |
| Mining | 0.6% | 0.3% | -0.9% | 2.7% | -1.6% | -0.6% |
| Utilities | 0.3% | -1.6% | 0.7% | 0.2% | 2.0% | 1.4% |
by Tom Moeller July 17, 2007
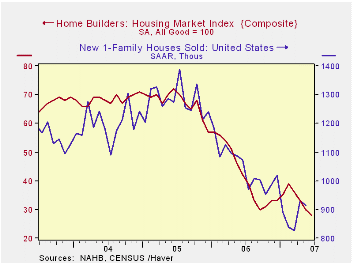
The Composite Housing Market Index from the National Association of Home Builders' (NAHB) fell last month to the lowest level since early 1991. At 28 for June, the index fell 6.7% from May and fell by one third from a year earlier.
During the last twenty years there has been a 76% correlation between the y/y change in the Composite Index and the change in single family housing starts.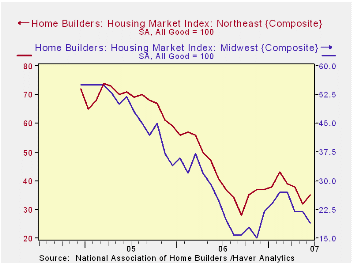
The sub-index for current sales also fell 6.5% from May (-38.3% y/y) and the sub-index covering prospective sales in the next six months fell 4.9% m/m (-23.5% y/y).
Traffic of prospective home buyers fell 4.5% (-27.6% y/y).
The NAHB index is a diffusion index based on a survey of builders. Readings above 50 signal that more builders view conditions good than poor.
Visit the National Association of Home Builders.
| Nat'l Association of Home Builders | June | May | June '06 | 2006 | 2005 | 2004 |
|---|---|---|---|---|---|---|
| Composite Housing Market Index | 28 | 30 | 42 | 42 | 67 | 68 |
by Louise Curley July 17, 2007
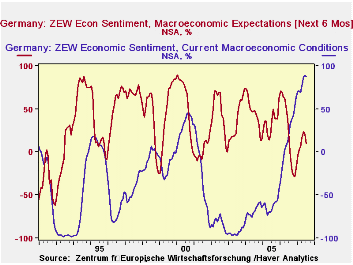
The July ZEW survey of German institutional investors and analysts revealed a sharp deterioration in the excess of those who see improvement in the economic outlook six months ahead and those who see worsening conditions. The excess in July was 10.4% compared with 20.3% in June. The historical average of optimists over pessimists is 32.8%.
The participants in the ZEW survey also expressed slightly less confidence in the current situation. The excess of optimists regarding current conditions fell to 88.2% in July from 88.7% in June, nevertheless, the confidence in the current situation is among the strongest reported over the entire history of the survey, as can be seen in the first chart.
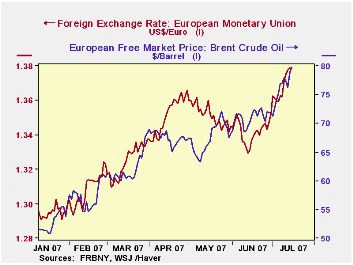
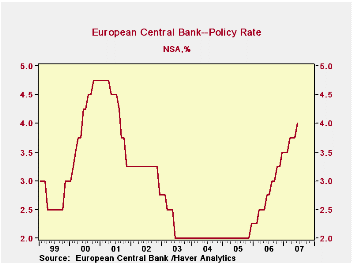
Concerns over the rising price of oil, the strengthening of the euro and higher interest rates may have accounted for some of the weakening confidence among the financial community. Although there was some relief to the rising price of oil and strengthening of the Euro in the second quarter of this year, the price of oil has risen almost 58% from the low point of the year of January 18, to July 16 and the euro is up almost 7% over the same period. The daily prices of a barrel of Brent Crude and the dollar exchange rates of the euro for the current year are shown in the second chart. While the European Central Bank (ECB) did not raise rates at its last meeting, its base rate has risen steadily over the last 18 months from 2% in November, 2005 to 4% currently, as shown in the third chart. Moreover, the bank continues to stress that further tightening may be needed.
  |
| GERMANY | July 07 | June 07 | July 06 | M/M Chg | Y/Y Chg | 2006 | 2005 | 2004 |
|---|---|---|---|---|---|---|---|---|
| ZEW Indicator (%) | ||||||||
| Expectations 6 mo ahead | 10.4 | 20.3 | 15.1 | -9.9 | -4.7 | 22.3 | 34.8 | 44.6 |
| Current conditions | 88.2 | 88.7 | 23.3 | -0.5 | 64.9 | 18.3 | -61.8 | -67.0 |
| 7/16/07 | 1/18/07 | % Chg | ||||||
| Euro/Dollar Exchange rate | 1.38 | 1.29 | 6.98 | -- | -- | -- | -- | -- |
| Price of Oil per bbl. Brent Crude | 79.73 | 50.83 | 57.91 | -- | -- | -- | -- | -- |
by Robert Brusca July 17, 2007
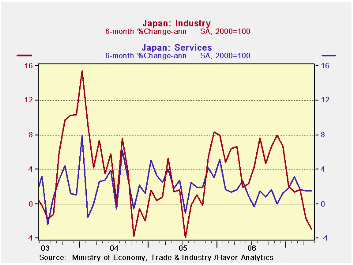
The Industry index from METI is in a sharp decline and is lower over six months for a period of three months running. Services (the tertiary index) tend to be more stable. Their index has slowed in the past few months and even fell in May but it is growing at pace just below 2%.
The tertiary and industry index are still relatively strong in their five year context. Fixing them in the range of values they have experienced over the past five years we find that the tertiary index is in its 95Th percentile (top 5-percent). The Industrial gauge is a bit lower but resides in the 84th percentile about the top 15 percentile of its range. The percentile standing of the MFG sector is higher than we get from other surveys of Japan (NTC has the MFG sector in the bottom 30 percent of its five year range). Japan remains unconcerned about this weakness and the BoJ continues to talk of when it will go back to hiking rates. Onew BOJ board member thinks they should already have hiked them again.
| Raw readings of each survey | Percent of 5Yr range* | ||||
| Biz Activity (METI:Indexes) | May-07 | Apr-07 | Mar-07 | May-07 | Apr-07 |
| Industry | 107.1 | 107.4 | 107.6 | 84.9% | 86.7% |
| Tertiary (Services) | 110.2 | 110.3 | 108.6 | 95.1% | 96.1% |
| *100 is high; Zero is low | |||||

Tom Moeller
AuthorMore in Author Profile »Prior to joining Haver Analytics in 2000, Mr. Moeller worked as the Economist at Chancellor Capital Management from 1985 to 1999. There, he developed comprehensive economic forecasts and interpreted economic data for equity and fixed income portfolio managers. Also at Chancellor, Mr. Moeller worked as an equity analyst and was responsible for researching and rating companies in the economically sensitive automobile and housing industries for investment in Chancellor’s equity portfolio. Prior to joining Chancellor, Mr. Moeller was an Economist at Citibank from 1979 to 1984. He also analyzed pricing behavior in the metals industry for the Council on Wage and Price Stability in Washington, D.C. In 1999, Mr. Moeller received the award for most accurate forecast from the Forecasters' Club of New York. From 1990 to 1992 he was President of the New York Association for Business Economists. Mr. Moeller earned an M.B.A. in Finance from Fordham University, where he graduated in 1987. He holds a Bachelor of Arts in Economics from George Washington University.
More Economy in Brief


