 Global| May 11 2009
Liquidity, Exchange Rates & Commodity Prices Point Toward U.S. Economic Improvement
by:Tom Moeller
|in:Economy in Brief
Summary
Expanding on last week's piece Louise Curley Curley on the Haver Analytics website, past deflation of pricing power has eased and may be tuning positive. By extension, U.S. economic improvement may be in the offing. What is unknown, of [...]
Expanding on last week's piece by Louise Curley on the Haver Analytics website, past deflation of pricing power has eased and may be tuning positive. By extension, U.S. economic improvement may be in the offing. What is unknown, of course, is when the improvement sets in and how strong it will be. To begin with, economic liquidity is on the rise. The yield spread between the 10-year Treasury note and the Federal funds rate has steepened dramatically since its inverted stance at the beginning of last year. That steepening occurred as Treasury yields first dropped sharply when the recession intensified late last year, then rose as the economic news was digested. The Fed's response to the recession was, of course, to first lower the Fed funds rate to near zero and then leave it there, pumping in economic liquidity all the while.
Liquidity indeed has increased due to the Fed's actions. Though it decelerated recently, growth the money stock (M2) over the last six months has roughly tripled to 15% while the level of bank reserves has more than doubled. These increases have yet, however, to translate into any surge in economic activity. Indeed, the lags between liquidity provision and overall economic activity have been up to six months in the past, and they likely will be longer this time around. The "front-end" economic response to Fed easing comes from the consumer & housing sectors. Historically, retail spending recovered quickly at a rate of 5% or more to end recessions. This time, while spending has stabilized, a robust recovery is in question. A rebuilding of consumers' balance sheets, i.e. a rise in the savings rate, has started but may take some time to play out. Moreover, any delay in a spending recovery may be lengthened by consumer demographics. They soon will dampen the spending impetus with the aging of the baby-boom population. That all will dampen any improvement in housing activity, which has yet to materially begin.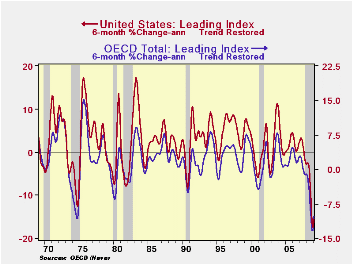
The rise in liquidity has yet to devalue the U.S. dollar. A lower dollar would improve the outlook for exports with lower prices and dampen imports with higher prices. The delay probably is the result of the developing economic weakness abroad. In fact, the dollar's trade-weighted value rose by 20% as of early this year and is down just moderately since its peak this March. The dollar really is not working much as a stabilizing factor of the U.S. foreign trade imbalance.
Commodity prices have strengthened significantly with more liquidity. Lower oil prices last year pulled down the measures of industrial commodity prices, but this year the measures have risen. That not only reflects the moderate recovery in oil which has raised the FIBER commodity price measure by more than one-quarter, but metals prices have risen as well. Copper scrap prices have nearly doubled from their January low while aluminum prices have risen 15% during the last two months. Steel scrap prices have moved sideways since January, but the level is up by nearly one half from the December low. Lead and zinc prices have significantly strengthened as well. In addition to higher metals prices are several indications that activity outside of the industrial sector is recovering. Prices for cotton are now one-third higher than this past March. Even the housing-related prices of framing lumber and wallboard bottomed and have risen modestly.
When these signals will translate into an end to the U.S. recession is, of course, the overriding question. The Blue Chip economic forecast indicates that recovery will begin in the second half of this year. But while economic growth typically has surged following past recessions, the Consensus forecast is for just 2.1% growth next year followed by moderate 2.5% to 3.0% growth in the years following. As for prices, the recovery in economic activity, combined with the liquidity highlighted above, is expected to halt any decline in prices. Indeed, consumer price inflation is expected to stabilize next year then rise to a 2.5% rate in 2011 and thereafter.
The figures referenced above are available in Haver's USWEEKLY database. The Blue Chip Economic forecast data is in USECON.
Lessons of the Financial Crisis for Banking Supervision is last week's speech by Fed Chairman Ben S. Bernanke and it can be found here.
German Industrial Output Halts Its Strong Of Declinesby Robert Brusca May 11, 2009
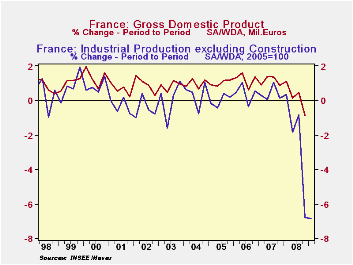
On a seasonally adjusted basis, industrial production in France declined 1.4% from February to March; and, in Italy, 4.6.%. For the quarter industrial production in France was down 6.8% compared with 6.9% in the fourth quarter. The comparable figures for Italy were 8.4% and 9.8%. To the extent that industrial production is a predictor of gross domestic product, these figures suggest that the first quarter decline in GDP in France will be about the same as in the fourth quarter of last year, that is, 1.12% (or 4.4% at an annual rate), while that in Italy is likely to be somewhat greater than the 1.49% (or 7.5% at an annual rate) in the fourth quarter of last year. The first chart shows quarterly data for industrial production and GDP for France and the second, the similar data for Italy.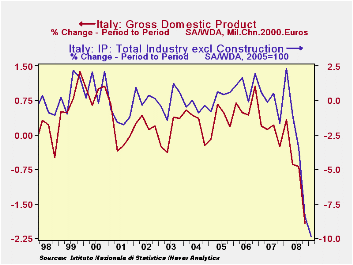
These production data indicate the depth and severity of the recession in these countries in the first quarter, but should not detract from the implications of more recent data such as the purchasing managers surveys and business confidence measures that suggest that the these economies are, at worst reaching a bottom or at best, showing faint signs of improvement.
One can even see some light in the monthly unadjusted production data. The year over year decline in industrial product in France was 12.6% in March, down from 18.6% in February. The comparable figures for Italy were 18.2% and 24.1%
| Mar 09 | Feb 09 | Jan 09 | Mar 09 | Feb 09 | Jan 09 | |
|---|---|---|---|---|---|---|
| Italy | Index | Index | Index | M/M % | M/M % | M/M % |
| Industrial Production SA | 80.8 | 84.7 | 88.8 | -4.60 | -4.62 | 1.22 |
| (2005=100) | Y/Y % | Y/Y % | Y/Y % | |||
| Industrial Production NSA | 81.6 | 85.4 | 90.6 | -18.23 | -24.09 | -22.80 |
| France | M/M % | M/M % | M/M % | |||
| Industrial Production SA | 84.6 | 85.5 | 86.2 | -1.37 | -0.91 | -3.92 |
| (2005=100) | Y/Y % | Y/Y % | Y/Y % | |||
| Industrial Production NSA | 93.0 | 85.5 | 89.0 | -12.59 | -18.57 | -16.04 |
Taken in a rather broad perspective the downturn according to the OECD’s LEIs which are cyclically adjusted is quite severe; the worst since 1970, at least. But the US and several counties in OECD Europe are showing signs of doing less badly which means, potentially, showing signs of turning the corner on recession.
Readings for France and Italy are up for three months running through March. China and UK indices are up for two months in a row. The OECD has characterized these economies and well as the OECD regions as being in a ‘strong slowdown’. It now says that in France, Italy and the UK troughs may have been reached.
Among developing countries China shows the clearest sign of troughing while Brazil and India continue to emit signals that say that they are still declining.
| Growth progression-SAAR | ||||
| 3Mos | 6Mos | 12mos | Yr-Ago | |
| OECD | -5.7% | -10.4% | -9.5% | -0.7% |
| OECD7 | -8.8% | -13.0% | -10.9% | -1.3% |
| OECD US | -11.5% | -15.6% | -12.1% | -1.0% |
| Six month readings at 6-Mo Intervals: | ||||
| Recent six | 6Mo Ago | 12Mo Ago | 18MO Ago | |
| OECD | -10.4% | -8.5% | -1.2% | -0.3% |
| OECD7 | -13.0% | -8.7% | -1.9% | -0.7% |
| OECD US | -15.6% | -8.4% | -2.6% | 0.7% |
| OECD JAPAN | -15.6% | -8.4% | -2.6% | 0.7% |
| Slowdowns indicated by BOLD RED | ||||

Tom Moeller
AuthorMore in Author Profile »Prior to joining Haver Analytics in 2000, Mr. Moeller worked as the Economist at Chancellor Capital Management from 1985 to 1999. There, he developed comprehensive economic forecasts and interpreted economic data for equity and fixed income portfolio managers. Also at Chancellor, Mr. Moeller worked as an equity analyst and was responsible for researching and rating companies in the economically sensitive automobile and housing industries for investment in Chancellor’s equity portfolio. Prior to joining Chancellor, Mr. Moeller was an Economist at Citibank from 1979 to 1984. He also analyzed pricing behavior in the metals industry for the Council on Wage and Price Stability in Washington, D.C. In 1999, Mr. Moeller received the award for most accurate forecast from the Forecasters' Club of New York. From 1990 to 1992 he was President of the New York Association for Business Economists. Mr. Moeller earned an M.B.A. in Finance from Fordham University, where he graduated in 1987. He holds a Bachelor of Arts in Economics from George Washington University.
More Economy in Brief


