 Global| Aug 18 2005
Leading Indicators Rose Again in July
by:Tom Moeller
|in:Economy in Brief
Summary
The Composite Index of Leading Economic Indicators reported by the Conference Board rose 0.1% during July following a upwardly revised 1.2% jump in June. Six-month growth in the leaders improved to 2.2%, the best since February. The [...]
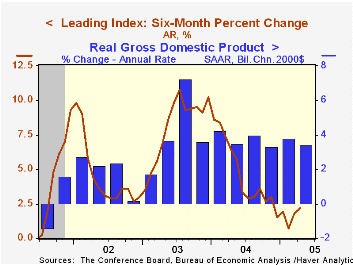
The Composite Index of Leading Economic Indicators reported by the Conference Board rose 0.1% during July following a upwardly revised 1.2% jump in June. Six-month growth in the leaders improved to 2.2%, the best since February.
The breadth of one month gain amongst the 10 components of the leading index slipped to 65% from 85% during June. A wider interest rate spread between the yield on 10 Year Treasuries & Fed Funds, higher stock prices and fewer claims for unemployment insurance made the largest positive contributions to the leader's July increase.
The method of calculating the contribution to the index from the interest rate yield spread has been revised. A negative contribution will now occur only when the spread inverts rather than when declining as in the past. More details can be found here.
The leading index is based on eight previously reported economic data series. Two series, orders for consumer goods and orders for capital goods, are estimated.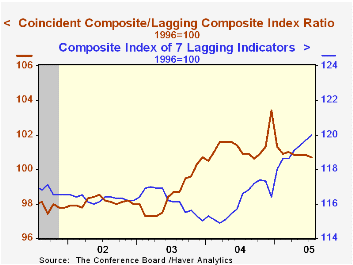
The coincident indicators rose 0.1% (2.6% y/y) with each of the four components up during the last three months.
The lagging indicators rose 0.3%, the same as during the prior month.
As higher short term interest rates and faster growth in the services CPI have raised the lagging indicators versus earlier declines, the ratio of coincident to lagging indicators has moved sideways this year and is down sharply from the December '04 peak. The ratio measures actual economic performance against economic excess.
Visit the Conference Board's site for coverage of leading indicator series from around the world.
The July 2005 Senior Loan Officer Opinion Survey on Bank Lending Practices from the Federal Reserve Board can be found here.
| Business Cycle Indicators | July | June | 6-Month Chg | 2004 | 2003 | 2002 |
|---|---|---|---|---|---|---|
| Leading | 0.1% | 1.2% | 2.2% | 7.7% | 5.1% | 5.0% |
| Coincident | 0.1% | 0.3% | 2.2% | 2.7% | 0.4% | -0.6% |
| Lagging | 0.3% | 0.3% | 3.4% | -0.1% | -0.1% | -0.7% |

Tom Moeller
AuthorMore in Author Profile »Prior to joining Haver Analytics in 2000, Mr. Moeller worked as the Economist at Chancellor Capital Management from 1985 to 1999. There, he developed comprehensive economic forecasts and interpreted economic data for equity and fixed income portfolio managers. Also at Chancellor, Mr. Moeller worked as an equity analyst and was responsible for researching and rating companies in the economically sensitive automobile and housing industries for investment in Chancellor’s equity portfolio. Prior to joining Chancellor, Mr. Moeller was an Economist at Citibank from 1979 to 1984. He also analyzed pricing behavior in the metals industry for the Council on Wage and Price Stability in Washington, D.C. In 1999, Mr. Moeller received the award for most accurate forecast from the Forecasters' Club of New York. From 1990 to 1992 he was President of the New York Association for Business Economists. Mr. Moeller earned an M.B.A. in Finance from Fordham University, where he graduated in 1987. He holds a Bachelor of Arts in Economics from George Washington University.
More Economy in Brief


