 Global| Feb 21 2006
Leading Economic Indicators Surged
by:Tom Moeller
|in:Economy in Brief
Summary
The Conference Board reported that the Composite Index of Leading Economic Indicators surged 1.1% last month, nearly twice the Consensus expectation, following an upwardly revised 0.3% increase during December. The breadth of one [...]
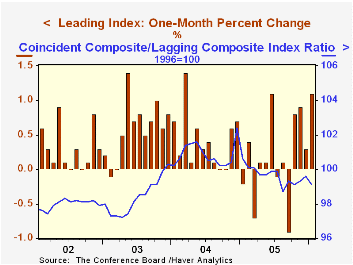
The Conference Board reported that the Composite Index of Leading Economic Indicators surged 1.1% last month, nearly twice the Consensus expectation, following an upwardly revised 0.3% increase during December.
The breadth of one month gain amongst the 10 components of the leading index improved to 70% in January although over six months the breadth of gain in the leaders slipped back to a still-high 70% from 90%.
Fewer initial claims for unemployment insurance and a higher real level of M2 made the largest positive contributions to last month's gain the leading index. Vendor performance, building permits and stock prices made lesser positive contributions.
The .01 percentage point positive contribution from the spread between yields on the 10 year Treasury Note and the Fed funds rate was the smallest since 2001. The method of calculating the contribution to the index from the interest rate yield spread has been revised. A negative contribution will now occur only when the spread inverts rather than when declining as in the past. More details can be found here.
The leading index is based on eight previously reported economic data series. Two series, orders for consumer goods and orders for capital goods, are estimated.
The coincident indicators rose 0.2% following an unrevised 0.2% December increase. All of the four component series rose over the last six months. During the last ten years there has been a 64% correlation between the change in the coincident indicators and real GDP.
The lagging indicators surged 0.7% following a revised 0.1% December decline. Higher C&I loans and a longer duration of unemployment accounted for most of the increase. The ratio of coincident to lagging indicators, a measure of actual economic performance versus excess, fell and reversed two months of gain.
Visit the Conference Board's site for coverage of leading indicator series from around the world.
The Taxation of Equity, Dividends, and Stock Prices from the Federal Reserve Bank of Boston is available here.
| Business Cycle Indicators | Jan | Dec | 6 Month Chg., AR | 2005 | 2004 | 2003 |
|---|---|---|---|---|---|---|
| Leading | 1.1% | 0.3% | 2.1% | 2.3% | 7.4% | 5.0% |
| Coincident | 0.2% | 0.2% | 1.5% | 2.2% | 2.5% | 0.4% |
| Lagging | 0.7% | -0.1% | 3.4% | 3.5% | 0.0% | -0.0% |
by Tom Moeller February 21, 2006
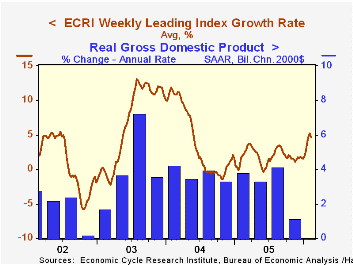
The weekly leading index of the US economy published by the Economic Cycle Research Institute (ECRI) slipped during the last three weeks after picking up considerable momentum in early January. The index declined 0.9% last week after two back to back weekly declines of 0.1%.
During the last ten years there has been a 53% correlation between the change in the weekly leading index and US real GDP growth during the following quarter. The correlation has risen to 76% during the last five years.
Despite the recent weakness, the six month growth rate of the leaders at 4.7% is much improved from last year's meandering growth rate of 1.9% which typified growth during much of the year.
Visit the Economic Cycle Research Institute for analysis of US and international business cycles.
How Should Monetary Policymakers Cope with Uncertainty?, a speech by Cathy E. Minehan, President and Chief Executive Officer, Federal Reserve Bank of Boston can be found here.
| Economic Cycle Research Institute | 02/10/06 | 12/30/05 | Y/Y | 2005 | 2004 | 2003 |
|---|---|---|---|---|---|---|
| Weekly Leading Index | 136.9 | 135.7 | 2.1% | 134.5 | 132.6 | 124.9 |
| 6 Month Growth Rate | 4.7% | 5.2% | 1.9% | 4.2% | 6.7% |
by Louise Curley February 21, 2006
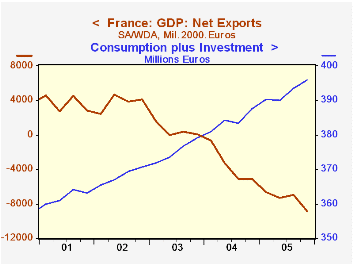
French real Gross Domestic Product rose only 0.2% in the fourth quarter of 2005 over the third quarter. For the year, GDP was up 1.4%. A growing deficit on foreign trade continued to offset modest gains in domestic demand, that is, consumption plus investment as shown in the first chart.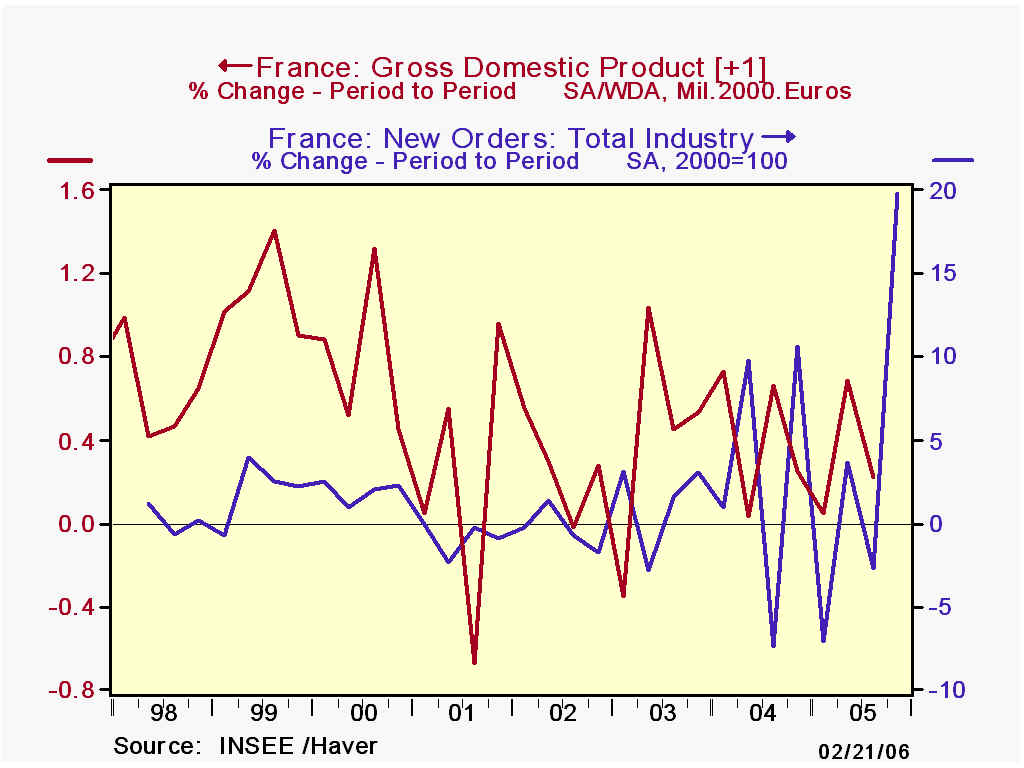
A stunning increase in new industrial orders in the fourth quarter of 2005, suggests that GDP growth in the current quarter could surprise on the upside. While new industrial orders are only a small part of the total economy, they are an important catalyst for future growth. There is a loose relationship between the change in new industrial orders and the change in real GDP one quarter later, as shown in the second chart. (We have aggregated the new industrial order series on a quarterly basis to facilitate comparison with GDP movements.)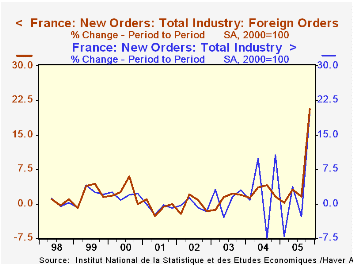
Total new orders increased 19.7% in the fourth quarter of 2005, the largest quarterly increase recorded since the series first began in 1998. Most of the rise was due to a big jump in foreign new orders which rose 20.5% in the quarter. This too was a record increase. Changes in total and foreign new orders are shown in the third chart, which covers the entire period for which the data are available.
| France: GDP and New Industrial Orders | Q4 05 | Q3 05 | Q4 045 | Q/Q % | Y/Y % | 2005 | 2004 | 2003 |
|---|---|---|---|---|---|---|---|---|
| GDP (Bil. 2000 Euros) | 391.2 | 390.4 | 386.5 | 0.2 | 1.2 | 1,556.8 | 1,535.4 | 1,504.6 |
| Total Consumption | 318.4 | 316.7 | 312.8 | 0.6 | 1.8 | 1,263.2 | 1,239.5 | 1,210.7 |
| Total Fixed Investment | 77.4 | 76.9 | 74.9 | 0.6 | 3.3 | 306.5 | 296.7 | 290.6 |
| Consumption+Investment | 395.9 | 393.6 | 387.7 | 0.6 | 2.1 | 1,569.8 | 1,536.2 | 1,501.2 |
| Net Export of Goods & Service | -8.9 | -7.0 | -5.1 | -1.9* | -3.8* | -29.8 | -14.1 | 2.0 |
| New Industrial Orders (2000=100) | ||||||||
| Total | 130.8 | 109.2 | 116.5 | 19.7 | 12.2 | 115.2 | 109.8 | 100.4 |
| Foreign | 146.6 | 121.6 | 115.8 | 20.5 | 26.6 | 125.9 | 111.3 | 101.6 |

Tom Moeller
AuthorMore in Author Profile »Prior to joining Haver Analytics in 2000, Mr. Moeller worked as the Economist at Chancellor Capital Management from 1985 to 1999. There, he developed comprehensive economic forecasts and interpreted economic data for equity and fixed income portfolio managers. Also at Chancellor, Mr. Moeller worked as an equity analyst and was responsible for researching and rating companies in the economically sensitive automobile and housing industries for investment in Chancellor’s equity portfolio. Prior to joining Chancellor, Mr. Moeller was an Economist at Citibank from 1979 to 1984. He also analyzed pricing behavior in the metals industry for the Council on Wage and Price Stability in Washington, D.C. In 1999, Mr. Moeller received the award for most accurate forecast from the Forecasters' Club of New York. From 1990 to 1992 he was President of the New York Association for Business Economists. Mr. Moeller earned an M.B.A. in Finance from Fordham University, where he graduated in 1987. He holds a Bachelor of Arts in Economics from George Washington University.
More Economy in Brief


