 Global| Jul 18 2006
June PPI Firm & Core Tame M/M, Pricing Trends Elevated
by:Tom Moeller
|in:Economy in Brief
Summary
The June producer price index for finished goods increased 0.5% and exceeded Consensus expectations for a 0.3% rise. Excluding food & energy, however, prices rose an expected 0.2%. Despite the relatively tame m/m rise in prices less [...]
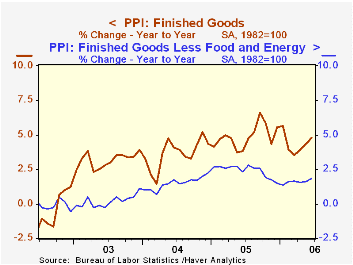
The June producer price index for finished goods increased 0.5% and exceeded Consensus expectations for a 0.3% rise. Excluding food & energy, however, prices rose an expected 0.2%.
Despite the relatively tame m/m rise in prices less food & energy, year to date prices have risen at a 3.1% annual rate, the fastest six month rate of increase since early last year. During the last ten years there has been a 47% correlation between the y/y change in core producer prices and the change in the core CPI for goods. Over the last twenty years the correlation has been 78%.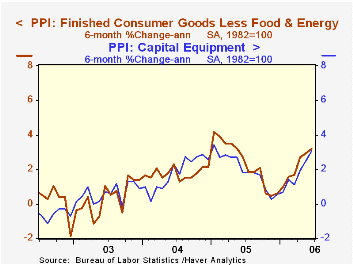
Prices of all finished consumer goods less food & energy rose 0.2% (1.9% y/y) and rose at a 3.2% annual rate during the last six months. Durable consumer goods prices rose 0.2% (1.0% y/y) and the 2.8% annual rate of advance during the last six months was the fastest since January '05. A tame 0.1% rise in consumer nondurable prices (2.5% y/y) also belied the elevated nature of the rise during the last six months at a 3.4% rate.
Capital equipment prices rose 0.3% (1.8% y/y) for the second consecutive month. Here again, however, the 3.1% annual rate of advance during the last six months is elevated and the fastest since January of last year.
Finished consumer food prices showed strength in June with a 1.4% (0.6% y/y) increase that was the strongest since May 2004. A 15.0% (NSA, 3.3% y/y) jump in fresh fruit & melon prices fueled the increase along with a 38.1% (NSA, 36.6% y/y) rise in egg prices.
Finished energy prices increased 0.7% (19.1% y/y) as gasoline prices surged 6.3% (44.3% y/y) though natural gas prices fell for the fifth month this year (+7.2% y/y) and residential electric power costs fell 2.8% (+5.2% y/y).
Intermediate goods prices rose 0.7% as energy prices increased 0.4% (19.2% y/y) and food prices jumped 1.0% (-0.4% y/y). Core intermediate prices also rose a strong 0.8%. The six month growth in core intermediate goods prices remained elevated at 7.7% versus a 5.5% advance last year.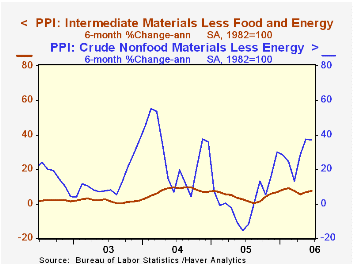
Crude goods prices reversed the prior month's strength with a 1.7% decline due to a 6.8% drop in energy prices (7.7% y/y). The decline reflected lower crude petroleum costs which have since risen to record high levels. In addition, core crude prices rose a strong 1.7%. Iron & steel scrap prices jumped a strong 6.2% (73.3% y/y) though aluminum base scrap prices eased 4.4% (+44.1% y/y). During the last thirty years "core" crude prices have been a fair indicator of industrial sector activity with a 48% correlation between the six month change in core crude prices and the change in factory sector industrial production.
The Relationship between Expected Inflation, Disagreement, and Uncertainty: Evidence from Matched Point and Density Forecasts from the Federal Reserve Bank of New York can be found here.
| Producer Price Index | June | May | Y/Y | 2005 | 2004 | 2003 |
|---|---|---|---|---|---|---|
| Finished Goods | 0.5% | 0.2% | 4.8% | 4.9% | 3.6% | 3.2% |
| Core | 0.2% | 0.3% | 1.9% | 2.4% | 1.5% | 0.2% |
| Intermediate Goods | 0.7% | 1.1% | 9.3% | 8.0% | 6.6% | 4.7% |
| Core | 0.8% | 1.1% | 7.2% | 5.5% | 5.7% | 2.0% |
| Crude Goods | -1.7% | 2.0% | 8.7% | 14.6% | 17.5% | 25.1% |
| Core | 1.7% | 6.2% | 33.7% | 4.8% | 26.5% | 12.4% |
by Tom Moeller July 18, 2006
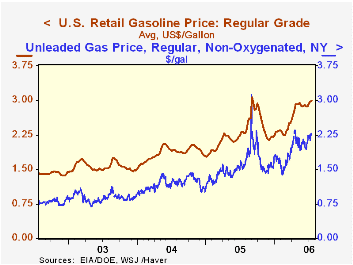
Versus the prior week, retail gasoline prices rose two cents last week to $2.99 per gallon (29.0% y/y). During June prices averaged $2.89.
A further increase in retail gas prices may be in store this week as the spot market price for regular unleaded gasoline yesterday at $2.25 was up another nickel from last week's average.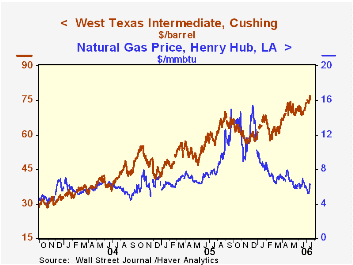
The price of West Texas Intermediate crude oil yesterday at $75.31 per barrel was about unchanged with last week's average but it was up sharply from the $70.96 averaged during June.
The latest Short-Term Energy and Summer Fuels Outlook from the U.S. Energy Information Administration can be found here.
| US Weekly | 07/17/06 | 07/10/06 | Y/Y | 2005 | 2004 | 2003 |
|---|---|---|---|---|---|---|
| U.S. Retail Gasoline, Regular per Gal. | $2.99 | $2.97 | 29.0% | $2.27 | $1.85 | $1.56 |
by Louise Curley July 18, 2006
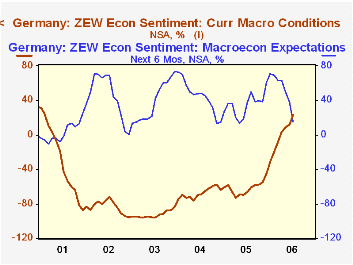
The ZEW institute of economic research polls some 300 institutional investors and analysts regarding their views of the current situation and their expectations of activity six months in the future. The excess of optimists over pessimists among the participants appraising the current situation rose to 23.3% from 11.8% in May. A year ago, in July, 2005, there was an excess of pessimists over optimists of 61.8%. There has been a steady improvement in the appraisal of current conditions since mid 2005.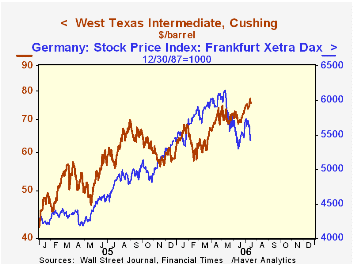
While the participants have become more positive about current economic conditions, they have become less positive about the outlook six months ahead as can be seen in the first chart. The excess of optimists over pessimists dropped 22.7 percentage points from 37,8% in June to 15.1% in July, the biggest drop since August,2002. For the first time, the six month horizon extends to 2007, when the value added tax (VAT) is scheduled to increase from 16% to 19% and health care contributions will be increased. In addition, the latest poll was conducted between June 26 and July 17. Towards the end of this period, the crisis in the mid east erupted leading to a jump in oil prices and a fall in stock market prices. The daily prices of the German Dax stock index and the prices of spot Brent crude oil are shown in the second chart. During the period June 26 to July 17, 2006, the oil price rose from an low of 69.69 on June 26 to just over 8% on July 17th. The stock market fell 5.5% from its high to July 17th.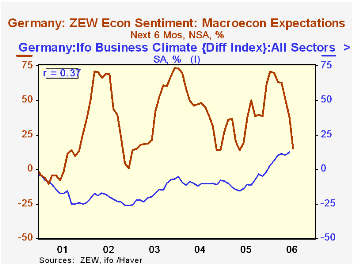
The ZEW indicator is sometimes thought to be a good indicator of the broader IFO Institute's survey, which usually comes out 10 to 15 days later. In fact there is little correlation between the two series as shown in the third chart. The third chart suggests that different temperaments of the participants in the two surveys may account for some of the divergence. The financial community whose opinions color the ZEW results, tend to be more volatile than those of the business community whose opinions are reflected in the IFO survey.
| ZEW Survey | Jul 06 | Jun 06 | Jul 05 | M/M Dif | Y/Y Dif | 2005 | 2004 | 2003 |
|---|---|---|---|---|---|---|---|---|
| Current Conditions % bal | 23.3 | 11.9 | -66.9 | 11.2 | 90.0 | -61.7 | -67.7 | -92.3 |
| Expectations 6 Mo Ahead | 15.1 | 37.8 | 32.0 | -22.7 | -21.9 | 34.8 | 44.6 | 38.4 |
| Change in Stock Prices and Oil | 7/17 | High or Low 6/27-7/17 | % Change | -- | -- | -- | -- | -- |
| German Stock Price DAX 12/30/87=1000) | 5416.96 | 5729.01H | -5.45 | -- | -- | -- | -- | -- |
| Spot Price of Oil-Brent $per bbl | 75.30 | 69.69L | 8.05 | -- | -- | -- | -- | -- |

Tom Moeller
AuthorMore in Author Profile »Prior to joining Haver Analytics in 2000, Mr. Moeller worked as the Economist at Chancellor Capital Management from 1985 to 1999. There, he developed comprehensive economic forecasts and interpreted economic data for equity and fixed income portfolio managers. Also at Chancellor, Mr. Moeller worked as an equity analyst and was responsible for researching and rating companies in the economically sensitive automobile and housing industries for investment in Chancellor’s equity portfolio. Prior to joining Chancellor, Mr. Moeller was an Economist at Citibank from 1979 to 1984. He also analyzed pricing behavior in the metals industry for the Council on Wage and Price Stability in Washington, D.C. In 1999, Mr. Moeller received the award for most accurate forecast from the Forecasters' Club of New York. From 1990 to 1992 he was President of the New York Association for Business Economists. Mr. Moeller earned an M.B.A. in Finance from Fordham University, where he graduated in 1987. He holds a Bachelor of Arts in Economics from George Washington University.
More Economy in Brief


