 Global| Jul 17 2006
June Industrial Production Rebounded
by:Tom Moeller
|in:Economy in Brief
Summary
Total U.S. industrial output rebounded 0.8% during June after a negligible 0.1% May gain that was upwardly revised. The rise outpaced Consensus expectations for a 0.5% increase. Factory sector output increased 0.8% (5.7% y/y) after a [...]
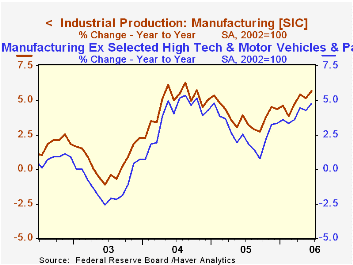
Total U.S. industrial output rebounded 0.8% during June after a negligible 0.1% May gain that was upwardly revised. The rise outpaced Consensus expectations for a 0.5% increase.
Factory sector output increased 0.8% (5.7% y/y) after a 0.1% May up tick. During the second quarter manufacturing sector output rose 5.4% (AR), the same as during 1Q.
Production of durable consumer goods surged 2.2% (3.3% y/y) as output of motor vehicles & parts 3.3% (3.1%) and computers & video equipment jumped 1.1% (10.5% y/y). These gains, however, were offset by a 1.8% (-1.7% y/y) decline in appliance & furniture production. A second 0.4% (1.1% y/y) gain in nondurable consumer goods output reflected a 0.8% (8.7% y/y) rise in clothing output.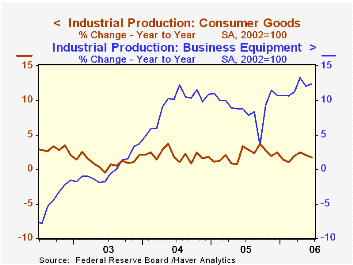
Business equipment production rose 0.7% (12.3% y/y) and more than recovered a 0.2% May decline. Production of information processing & equipment jumped another 1.3% (21.3% y/y).
Factory output less the hi-tech industries increased 0.7% (4.6% y/y). During 2Q this output measure rose 4.5% (AR) after a 4.8% gain during 1Q.
Overall capacity utilization rose to 82.4% in June, its highest level in six years. Factory sector utilization at 80.8% also is at its highest since 2000.
Diverging Measures of Capacity Utilization: An Explanation from the Federal Reserve Board can be found here.
| Production & Capacity | June | May | Y/Y | 2005 | 2004 | 2003 |
|---|---|---|---|---|---|---|
| Industrial Production | 0.8% | 0.1% | 4.5% | 3.2% | 4.1% | 0.6% |
| Manufacturing | 0.8% | 0.1% | 5.7% | 3.9% | 4.8% | 0.5% |
| Consumer Goods | 0.8% | 0.1% | 1.7% | 2.1% | 2.1% | 1.0% |
| Business Equipment | 0.7% | -0.2% | 12.3% | 9.1% | 9.3% | 0.0% |
| Capacity Utilization | 82.4% | 81.8% | 80.3% (6/05) | 80.1% | 78.6% | 75.7% |
by Tom Moeller July 17, 2006
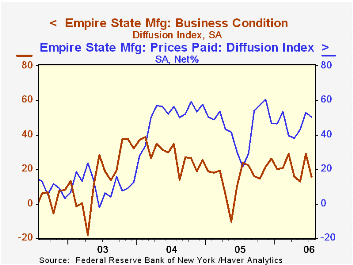
The Empire State Mfg. Index of General Business Conditions, reported by the Federal Reserve Bank of New York, during July reversed most of the prior month's surge and fell 13.37 points to 15.64. Consensus expectations had been for a lesser decline to 20.0.
Since the series' inception in 2001 there has been a 75% correlation between the index level and the three month change in U.S. factory sector industrial production.
New orders & shipments both reversed all of the prior month's improvement with sharp declines to the lowest levels of 2006. However, the index indicating the number of employees rose modestly m/m to a still low level.
Pricing pressure eased slightly. Since 2001 there has been an 88% correlation between the index of prices paid and the three month change in the core intermediate materials PPI.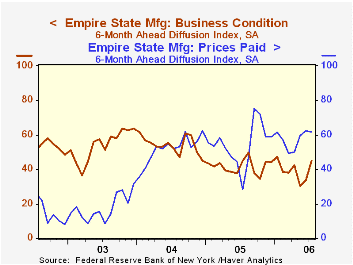
Like the Philadelphia Fed Index of General Business Conditions, the Empire State Business Conditions Index reflects answers to an independent survey question; it is not a weighted combination of the components.
The Empire State index of expectations for business conditions in six months for July rose sharply to the highest level since January as expected new orders surged.
The Empire State Manufacturing Survey is a monthly survey of manufacturers in New York State conducted by the Federal Reserve Bank of New York. Participants from across the state in a variety of industries respond to a questionnaire and report the change in a variety of indicators from the previous month. Respondents also state the likely direction of these same indicators six months ahead. April 2002 is the first report, although survey data date back to July 2001.
For more on the Empire State Manufacturing Survey, including methodologies and the latest report, click here.
The Predictive Abilities of the New York Fed’s Empire State Manufacturing Survey from the Federal Reserve Bank of New York is available here.
| Empire State Manufacturing Survey | July | June | July '05 | 2005 | 2004 | 2003 |
|---|---|---|---|---|---|---|
| General Business Conditions (diffusion index) | 15.64 | 29.01 | 23.61 | 15.56 | 28.79 | 15.98 |
by Louise Curley July 17, 2006
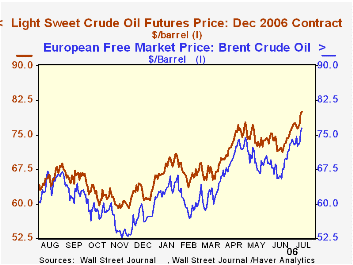
Several of the economic effects of the Middle East Crisis can be monitored using data found in various Haver Databases. Among the information to be found in the daily and weekly databases are stock prices, exchange rates, spot and future oil prices, and gasoline prices in major U.S. cities.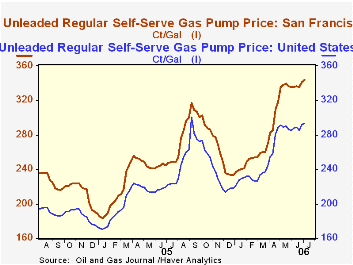
One of the most immediate effects of the crisis has been increases in the prices of oil and gasoline. Spot and future prices of oil are found in the DAILY database and are shown in the first chart. The spot price of Louisiana Sweet rose almost 5% in the week ending July 14 and was over 37% above July 14, 2005. The December 2006 contract price reached $80 a barrel on July 14.
The price of unleaded regular, self service gasoline at the pump for the U. S. and major cities is found in the OILWKLY database (Oil and Gas Weekly Journal.) In the second chart we show the average gasoline price for the U. S. and the gasoline price for San Francisco--one of the cities with above average prices. The average price of a gallon of gasoline in San Francisco was $3.438 on July 6 compared with $2.935 for the US as a whole. The OILWKLY database contains a wealth of information in addition to prices, such as supply and demand conditions, imports and exports and inventories.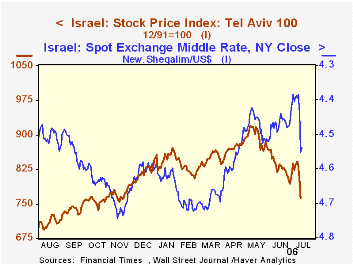
Some daily financial and economic data (mainly exchange rates and, in some cases, stock market indexes) are found in the INTDAILY dat base for individual countries in broad geographical regions. In the third chart we show the stock market index for Israel and the exchange rate. In the past week, the stock market declined by more than 8% and the exchange rate fell more than 3%. The MSCID database also gives daily stock market prices for many countries.
| July 14 06 | July 7 06 | Jul 14 05 | W/W% | Y/Y% | |
|---|---|---|---|---|---|
| Spot Oil Price LA. Sweet | 79.53 | 75.79 | 47.91 | 4.93 | 37.33 |
| Dec 2006 Contract Price | 80.00 | 76.83 | 58.86 | 4.13 | 35.92 |
| US Pump Price Unleaded, Self Serve Gasoline* | 293.5 | 291.6 | 222.0 | 0.65 | 32.21 |
| San Francisco Pump Price Unleaded, Self Serve* | 343.80 | 341.70 | 247.70 | 0.61 | 38.80 |
| Israel Stock Index Tel Aviv 100( 12/91/=100) | 763.31 | 834.58 | 686.75 | -8.34 | 11.15 |
| Israel Exchange Rate New Shequel/US$ | 4.5393 | 4.3579 | 4.5351 | -3.34 | -0.09 |
Tom Moeller
AuthorMore in Author Profile »Prior to joining Haver Analytics in 2000, Mr. Moeller worked as the Economist at Chancellor Capital Management from 1985 to 1999. There, he developed comprehensive economic forecasts and interpreted economic data for equity and fixed income portfolio managers. Also at Chancellor, Mr. Moeller worked as an equity analyst and was responsible for researching and rating companies in the economically sensitive automobile and housing industries for investment in Chancellor’s equity portfolio. Prior to joining Chancellor, Mr. Moeller was an Economist at Citibank from 1979 to 1984. He also analyzed pricing behavior in the metals industry for the Council on Wage and Price Stability in Washington, D.C. In 1999, Mr. Moeller received the award for most accurate forecast from the Forecasters' Club of New York. From 1990 to 1992 he was President of the New York Association for Business Economists. Mr. Moeller earned an M.B.A. in Finance from Fordham University, where he graduated in 1987. He holds a Bachelor of Arts in Economics from George Washington University.
More Economy in Brief
 Global| Feb 05 2026
Charts of the Week: Balanced Policy, Resilient Data and AI Narratives
by:Andrew Cates


