 Global| Aug 02 2002
July Payrolls Weak, Hours Plunge
by:Tom Moeller
|in:Economy in Brief
Summary
Payrolls rose less than expected last month, but moderate gains in May and June were revised up. Payrolls have fallen 0.1% YTD. The modest rise in July payrolls was accompanied by a sharp drop in the length of the workweek. As a [...]
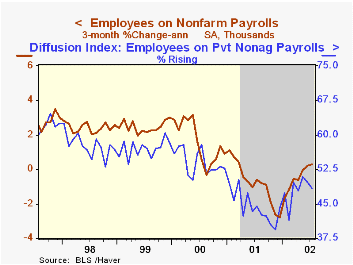
Payrolls rose less than expected last month, but moderate gains in May and June were revised up. Payrolls have fallen 0.1% YTD.
The modest rise in July payrolls was accompanied by a sharp drop in the length of the workweek. As a result, the index of aggregate hours worked (employment times hours worked) fell 0.6% and started the quarter 0.4% below the 2Q average.
Amongst industries, factory sector jobs fell by the least since April 2000. Construction jobs plunged 30,000, or 0.5%, and are down 1.6% so far this year. Jobs in service producing industries rose 46,000 despite a 16,000 decline in government employment. Private service producing jobs are up 0.3% YTD.
The one-month diffusion index for nonfarm payrolls again fell below the 50% level, to 48.4. The level suggests little or no employment growth near term. The three month diffusion index was 50.
Average hourly earnings rose as expected and the June gain was revised down slightly.
The unemployment rate held steady at it's high 2Q average. Both employment and the labor force fell.
The employment figures for nonfarm payrolls are based on reports provided to the US Labor Department by businesses, while the figures from which the unemployment rate is derived are based on a survey of US households.
| Employment | July | June | Y/Y | 2001 | 2000 | 1999 |
|---|---|---|---|---|---|---|
| Payroll Employment | 6,000 | 66,000 | -1.0% | 0.2% | 2.2% | 2.4% |
| Manufacturing | -7,000 | -13,000 | -5.1% | -4.2% | -0.4% | -1.3% |
| Average Weekly Hours | 34.0 | 34.3 | 34.2 | 34.2 | 34.4 | 34.5 |
| Average Hourly Earnings | 0.3% | 0.3% | 3.2% | 4.1% | 3.9% | 3.6% |
| Unemployment Rate | 5.9% | 5.9% | 4.6% | 4.8% | 4.0% | 4.2% |
by Tom Moeller August 2, 2002
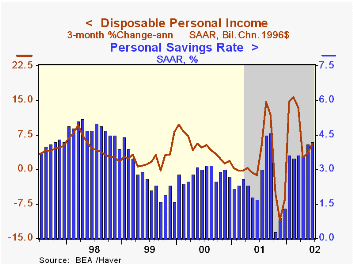
Personal income rose slightly more than expected in June. May's gain was revised slightly higher. Income is up 5.6% (AR) year-to-date.
Personal consumption expenditures rose slightly less than expected following benchmark revisions that generally lowered the level of spending. In chained 96 dollars, spending is up 2.9% (AR) year-to-date.
Wage and salary disbursements rose 0.7%, the strongest gain since July 2000. Wages are up 3.3% (AR) YTD.
Personal spending rose slightly less than expected. Durables spending was notably strong as unit sales of light vehicles rose 5.2%. Spending on nondurables and services rose moderately
Disposable income rose 0.7% (11.7% AR, YTD, following upwardly revised gains. Personal tax payments fell sharply in January and in five of six months this year.
The PCE price deflator rose 0.1% following an unrevised 0.1% decline in May. Prices were up 2.1% (AR) year to date. Less food and energy the price deflator rose 0.1% following no change in May.
| Disposition of Personal Income | June | May | Y/Y | 2001 | 2000 | 1999 |
|---|---|---|---|---|---|---|
| Personal Income | 0.6% | 0.4% | 3.4% | 3.3% | 8.0% | 4.9% |
| Personal Consumption | 0.5% | -0.0% | 4.2% | 4.5% | 7.0% | 6.7% |
| Savings Rate | 4.2% | 4.1% | 1.7% | 2.3% | 2.8% | 2.7% |
| PCE Price Deflator | 0.1% | -0.1% | 1.0% | 2.0% | 2.5% | 1.6% |
by Tom Moeller August 2, 2002
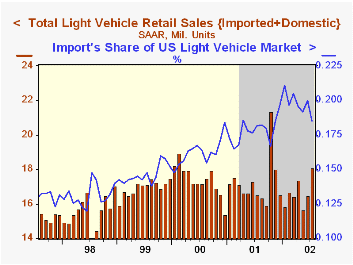
Unit sales of light vehicles rose 9.8% last month versus June as 0% financing plans spurred buying. Sales were quite a bit higher than expected and were the highest since October.
Sales of domestically built vehicles rose 11.8% m/m as both car and truck sales surged.
Imported vehicle sales rose 1.9% vs. June. Autos were about flat but truck sales were strong.
Imports captured 18.5% of the US light vehicle market in July, the lowest percentage this year.
| Light Vehicle Sales (SAAR, Mil.Units) | July | June | Y/Y | 2001 | 2000 | 1999 |
|---|---|---|---|---|---|---|
| Total | 18.10 | 16.48 | 9.7% | 17.25 | 17.40 | 16.95 |
| Domestic | 14.75 | 13.19 | 9.2% | 14.18 | 14.58 | 14.47 |
| Imported | 3.35 | 3.29 | 11.9% | 3.06 | 2.82 | 2.48 |
by Tom Moeller August 2, 2002
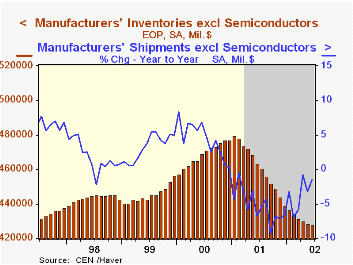
Manufacturing inventories fell by the least amount since the start of the runoff early last year. May's decline was unrevised.
Inventory decumulation amongst durable gods industries continued strong and was broad based. Nondurable goods inventories rose 0.4% after sideways movement most of the year. Gains were broad based but strongest for petroleum.
Shipments plunged 1.0% (-1.5% y/y) following three months of gain.
| Inventories | June | May | Y/Y | 2001 | 2000 | 1999 |
|---|---|---|---|---|---|---|
| Mfg Inventories | -0.1% | -0.4% | -7.7% | -8.0% | 4.5% | 3.1% |

Tom Moeller
AuthorMore in Author Profile »Prior to joining Haver Analytics in 2000, Mr. Moeller worked as the Economist at Chancellor Capital Management from 1985 to 1999. There, he developed comprehensive economic forecasts and interpreted economic data for equity and fixed income portfolio managers. Also at Chancellor, Mr. Moeller worked as an equity analyst and was responsible for researching and rating companies in the economically sensitive automobile and housing industries for investment in Chancellor’s equity portfolio. Prior to joining Chancellor, Mr. Moeller was an Economist at Citibank from 1979 to 1984. He also analyzed pricing behavior in the metals industry for the Council on Wage and Price Stability in Washington, D.C. In 1999, Mr. Moeller received the award for most accurate forecast from the Forecasters' Club of New York. From 1990 to 1992 he was President of the New York Association for Business Economists. Mr. Moeller earned an M.B.A. in Finance from Fordham University, where he graduated in 1987. He holds a Bachelor of Arts in Economics from George Washington University.
More Economy in Brief


