 Global| Jul 12 2005
JOLTS: U.S. Job Openings Eased
by:Tom Moeller
|in:Economy in Brief
Summary
The Bureau of Labor Statistics reported that the job openings rate, from the Job Openings & Labor Turnover Survey (JOLTS), eased in May to 2.5% while the previously reported April increase was revised away. The job openings rate is [...]
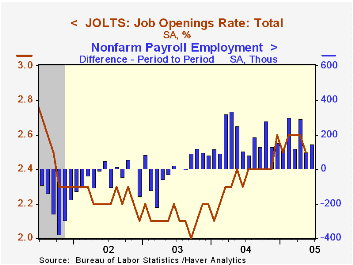
The Bureau of Labor Statistics reported that the job openings rate, from the Job Openings & Labor Turnover Survey (JOLTS), eased in May to 2.5% while the previously reported April increase was revised away. The job openings rate is the number of job openings on the last business day of the month as a percent of total employment plus job openings. The total number of job openings fell 3.1% m/m (+8.9% y/y) after a downwardly revised 0.6% decline during April
The hires rate recovered to 3.5% following the sharp decline in April. The hires rate is the number of hires during the month divided by employment.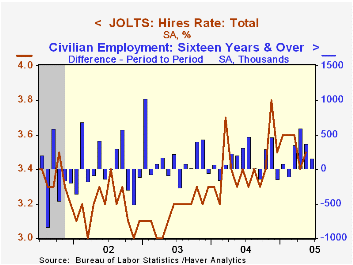
The job separations rate fell to 3.3% after having been elevated during the prior two month. Total separations include quits, layoffs, discharges, and other separations as well as retirements. The total separations, or turnover, rate is the total number of separations during the month divided by employment.
The survey dates only to December 2000 but has since followed the movement in nonfarm payrolls.
A description of the Jolts survey and the latest release from the U.S. Department of Labor is available here.
| JOLTS (Job Openings & Labor Turnover Survey) | May | April | May '04 | 2004 | 2003 | 2002 |
|---|---|---|---|---|---|---|
| Job Openings Rate: Total | 2.5% | 2.6% | 2.4% | 2.4% | 2.1% | 2.2% |
| Hires Rate: Total | 3.5% | 3.4% | 3.3% | 3.4% | 3.2% | 3.2% |
by Tom Moeller July 12, 2005
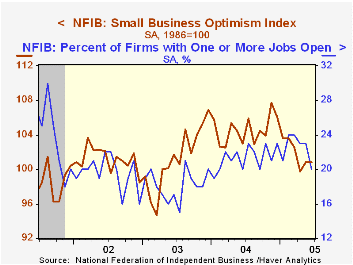
The Small Business Optimism Index reported by the National Federation of Independent Business (NFIB) remained stable in June with the somewhat improved level in May. The stability reflected contradictory indications of a sharp rise in the percentage of firms expecting the economy to improve but a decline in the percentage expecting higher real sales in six months.
During the last ten years there has been a 64% correlation between the level of the NFIB index and the two quarter change in real GDP.
The job outlook deteriorated as the percentage of firms planning to raise employment gave back half of the improvement in May and the percentage of firms with one or more job openings dropped to a nine month low. During the last ten years there has been a 67% correlation between hiring plans and the three month growth in nonfarm payrolls.
The percentage of firms planning to raise capital spending was stable at a somewhat improved May level of 33%.
The percentage of firms raising average selling prices rose.
About 24 million businesses exist in the United States. Small business creates 80% of all new jobs in America.
| Nat'l Federation of Independent Business | June | May | Y/Y | 2004 | 2003 | 2002 |
|---|---|---|---|---|---|---|
| Small Business Optimism Index (1986=100) | 100.8 | 100.8 | -2.1% | 104.6 | 101.3 | 101.2 |
by Tom Moeller July 12, 2005
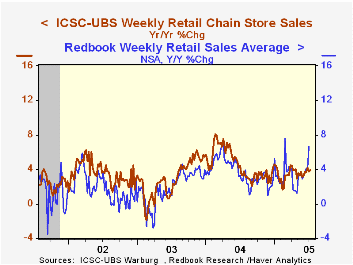
Chain store sales inched 0.1% higher last week following a 0.5% rise during the opening week of July, according to the International Council of Shopping Centers (ICSC)-UBS survey. So far this month sales are 0.3% higher than the June average which fell 0.4% versus May.
During the last ten years there has been a 56% correlation between the y/y change in chain store sales and the change in non-auto retail sales less gasoline, as published by the US Census Department. Chain store sales correspond directly with roughly 14% of non-auto retail sales less gasoline.
The leading indicator of chain store sales from ICSC rose 0.4% w/w (1.0% y/y) following no change during the week prior.
The ICSC-UBS retail chain-store sales index is constructed using the same-store sales (stores open for one year) reported by 78 stores of seven retailers: Dayton Hudson, Federated, Kmart, May, J.C. Penney, Sears and Wal-Mart.
Productivity and the Post-1990 U.S. Economy from the Federal Reserve Bank of St. Louis can be found here.
| ICSC-UBS (SA, 1977=100) | 07/09/05 | 07/02/05 | Y/Y | 2004 | 2003 | 2002 |
|---|---|---|---|---|---|---|
| Total Weekly Chain Store Sales | 455.7 | 455.2 | 3.9% | 4.6% | 2.9% | 3.6% |
by Louise Curley July 12, 2005
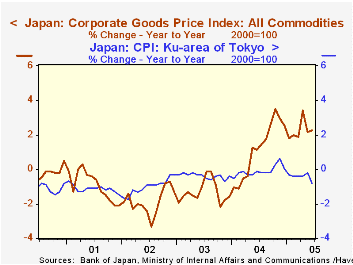
Signs that Japan's deflation may be ending remain equivocal. The Corporate Goods Price Index (CGPI) has been showing year to year increases since May, 2004. But corporations have been unable to pass these increases on to consumers. The first chart compares the year to year change in the CGPI and the Consumer Price Index. (Since the June CPI for all Japan is not yet available we have used the CPI for the Ku area of Tokyo, which, although lower than that for all Japan, has the same general trend.) This index declined in June and was almost 1% below June, 2004.
Another way of showing that so far, at least, corporations have been unable to pass on the higher cost of oil and other raw materials is shown in the second chart, which compares the indexes of raw material prices and of final goods prices. While the raw material price index in June was almost 17% above the level of June, 2004, the final goods index was 1% below its June, 2004 level.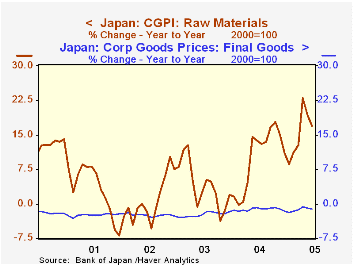
Partly offsetting the rise in raw material costs has been the continued deflation among some final goods resulting from increased productivity. It is highly likely that increased productivity accounts for much of the decline in the index for the price of electric machinery and equipment, which was 70.5 in June, indicating a price decline of almost 30% since the year 2000. Other sophisticated goods such as transportation equipment and precision instruments that have been selling at levels below 2000 have also benefited from increase productivity.
| Japan Indexes 2000=100 |
Jun 05 | May 05 | Jun 04 | M/M% | Y/Y% | 2004 | 2003 | 2002 |
|---|---|---|---|---|---|---|---|---|
| Corporate Goods Price Index | 99.3 | 99.3 | 97.1 | 0.0 | 2.3 | 97.1 | 96.0 | 97.2 |
| Consumer Price Index: Ku-area of Tokyo |
96.8 | 97.3 | 97.6 | -0.51 | -0.82 | 97.4 | 97.5 | 97.9 |
| GCPI Raw Materials | 141.2 | 142.2 | 120.8 | -0.70 | 16.89 | 118.5 | 107.7 | 103.7 |
| Petrol and Coal | 149.6 | 151.2 | 127.4 | -1.06 | 17.43 | 127.4 | 116.3 | 109.3 |
| GCP1 Final Goods | 91.0 | 91.1 | 92.0 | -0.11 | -1.09 | 91.8 | 92.9 | 95.2 |
| Elec. Machinery & Eqpt | 70.5 | 70.6 | 74.6 | -0.14 | -5.50 | 74.1 | 78.7 | 86.2 |
| Transportation Equip | 97.3 | 97.4 | 98.3 | -0.10 | -1.02 | 98.3 | 99.5 | 100.1 |
| Precision Instruments | 97.1 | 97.0 | 98.2 | 0.10 | -1.12 | 98.1 | 100.5 | 102.5 |

Tom Moeller
AuthorMore in Author Profile »Prior to joining Haver Analytics in 2000, Mr. Moeller worked as the Economist at Chancellor Capital Management from 1985 to 1999. There, he developed comprehensive economic forecasts and interpreted economic data for equity and fixed income portfolio managers. Also at Chancellor, Mr. Moeller worked as an equity analyst and was responsible for researching and rating companies in the economically sensitive automobile and housing industries for investment in Chancellor’s equity portfolio. Prior to joining Chancellor, Mr. Moeller was an Economist at Citibank from 1979 to 1984. He also analyzed pricing behavior in the metals industry for the Council on Wage and Price Stability in Washington, D.C. In 1999, Mr. Moeller received the award for most accurate forecast from the Forecasters' Club of New York. From 1990 to 1992 he was President of the New York Association for Business Economists. Mr. Moeller earned an M.B.A. in Finance from Fordham University, where he graduated in 1987. He holds a Bachelor of Arts in Economics from George Washington University.
More Economy in Brief


